


Apollo Energy publishes a daily energy market analysis, focusing on the gas, power and oil markets including a commentary on how the markets close and open. Our analysis provides insight on how the markets are performing and also considers various factors which could dictate price changes in the future.
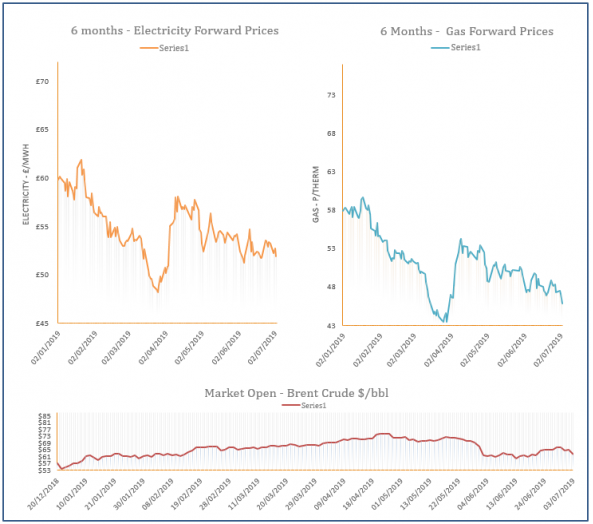
The analysis also contains a graph which tracks the one-year forward price of both gas and electricity as well as changes to Brent crude oil.
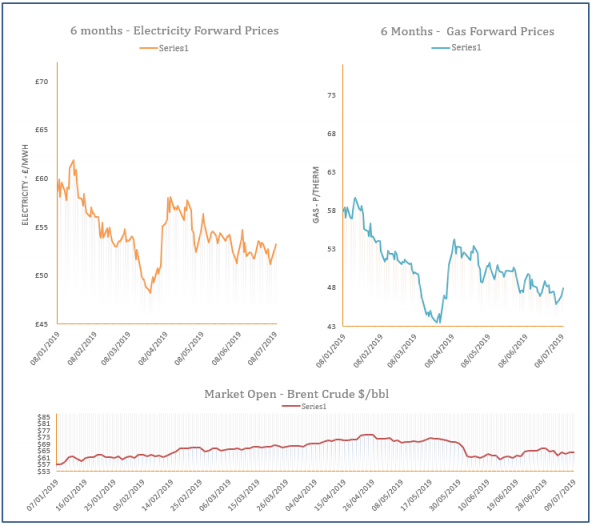
Energy Market Analysis –09-07-2019
9th July 2019 | Posted by: Daniel Birkett | Market Analysis
Gas prices increased throughout Monday’s session with Front-Month showing the most significant gain. A prolonged outage at the Nyhamna processing plant in Norway provided bullish pressure at the front of the curve, combined with weak renewables, while a rise in coal, carbon and oil supported the rest of the curve.
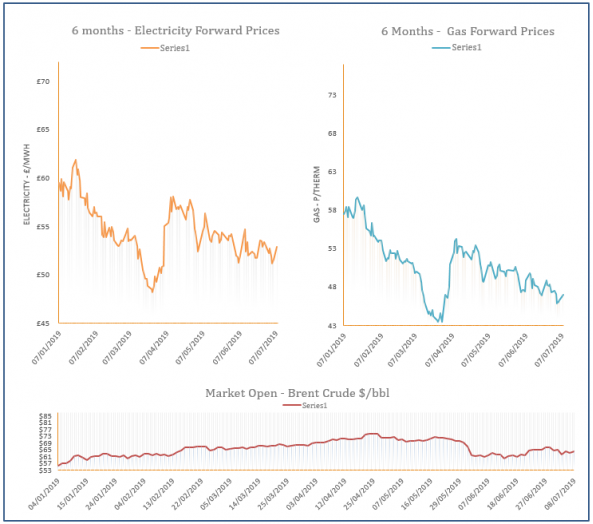
Energy Market Analysis –08-07-2019
8th July 2019 | Posted by: Daniel Birkett | Market Analysis
Near-curve gas prices increased on Friday due to a prolonged outage at the Nyhanma processing plant in Norway, with Front-Month increasing by over 10%. Meanwhile, contracts further along the curve followed rising coal & carbon and displayed gains.
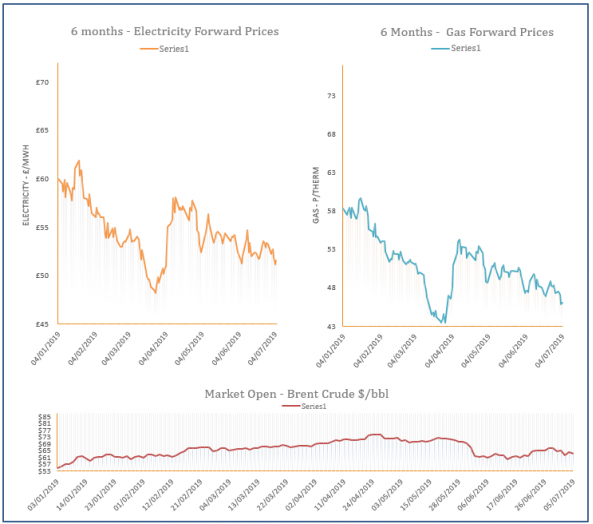
Energy Market Analysis –05-07-2019
5th July 2019 | Posted by: Daniel Birkett | Market Analysis
Gas prices were provided with mixed sentiment yesterday as oil moved down, while coal strengthened; as a result far-curve prices ended the session with minor gains. Meanwhile, the front of the curve was slightly bearish as supply levels are expected to rise.
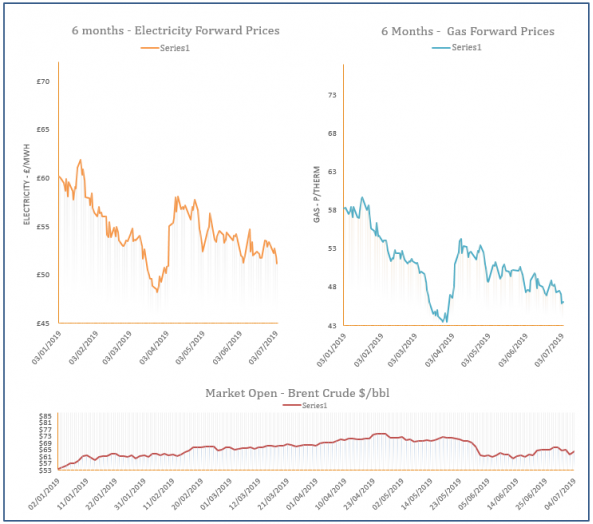
Energy Market Analysis –04-07-2019
4th July 2019 | Posted by: Daniel Birkett | Market Analysis
Near-curve gas prices moved higher during yesterday’s session and closed at a premium, with support provided by an undersupplied system. An outage at the Kollsnes processing plant and maintenance at the Troll field reduced flows into the UK, contributing to the undersupply. Meanwhile, far-curve prices followed oil and coal, closing down.
Energy Market Analysis –03-07-2019
3rd July 2019 | Posted by: Daniel Birkett | Market Analysis
Gas prices displayed mixed movement yesterday, with an expected rise in gas-fired power helping to lift the prompt, while milder weather weighed on the front-month contract. Further out, movement was generally bearish as coal, oil and carbon displayed losses.