


Apollo Energy publishes a daily energy market analysis, focusing on the gas, power and oil markets including a commentary on how the markets close and open. Our analysis provides insight on how the markets are performing and also considers various factors which could dictate price changes in the future.
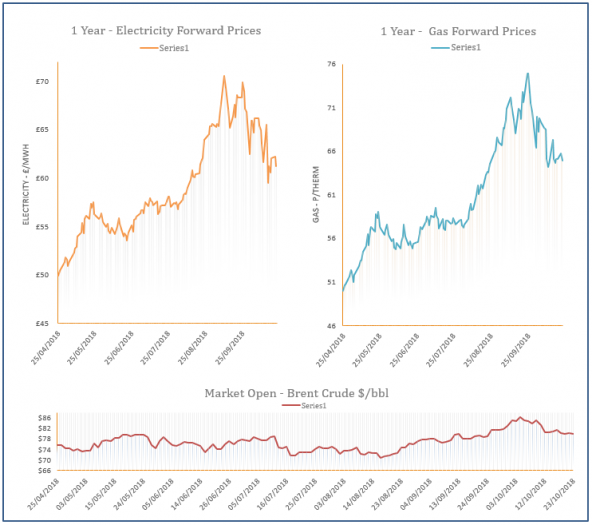
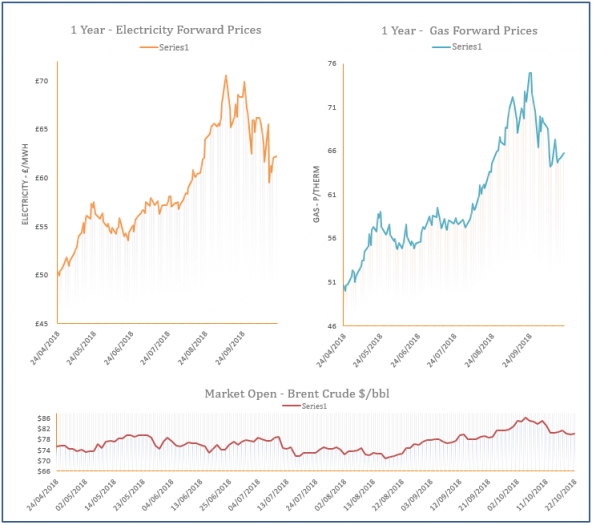
The analysis also contains a graph which tracks the one-year forward price of both gas and electricity as well as changes to Brent crude oil.

Energy Market Analysis – 24-10-2018
24th October 2018 | Posted by: Daniel Birkett | Market Analysis
Gas prices moved down on Tuesday with weaker stock markets and a drop in oil weighing on contracts across the curve. A decrease in both LDZ and CCGT demand, combined with comfortable supply also applied additional bearish pressure to the prompt.

Ofgem announce Industry Central Switching Service
24th October 2018 | Posted by: Daniel Birkett | Industry News
In an attempt to ensure a fast and reliable retail market for consumers, Ofgem have announced a Centralised Switching Service which would tie together gas and electricity systems.
Energy Market Analysis – 23-10-2018
23rd October 2018 | Posted by: Daniel Birkett | Market Analysis
Gas prices eased down on Monday with healthy supply levels weighing on contracts at the front of the curve. Improved wind levels reduced gas-fired power generation, while a milder weather outlook will result in a drop in heating demand. Meanwhile, weaker coal prices contributed to bearish movement at the back of the curve.
Energy Market Analysis – 22-10-2018
22nd October 2018 | Posted by: Daniel Birkett | Market Analysis
Gas prices displayed strong gains on Friday with the prompt climbing higher on the back of a sharp rise in demand levels. Norwegian flows improved slightly, providing some resistance to the front of the curve, while the far-curve found support from stronger coal and oil markets.

Energy Market Analysis – 19-10-2018
19th October 2018 | Posted by: Daniel Birkett | Market Analysis
The UK gas system was balanced yesterday as Norwegian flows were rerouted to mainland Europe and storage injections increased, resulting in gains at the front of the curve. A gas field in the UKCS also suffered an outage, reducing output by 6mcm/ day. Healthy LNG send-outs capped the gains somewhat, while the far-curve displayed small losses due to weakening commodities.