


Apollo Energy publishes a daily energy market analysis, focusing on the gas, power and oil markets including a commentary on how the markets close and open. Our analysis provides insight on how the markets are performing and also considers various factors which could dictate price changes in the future.
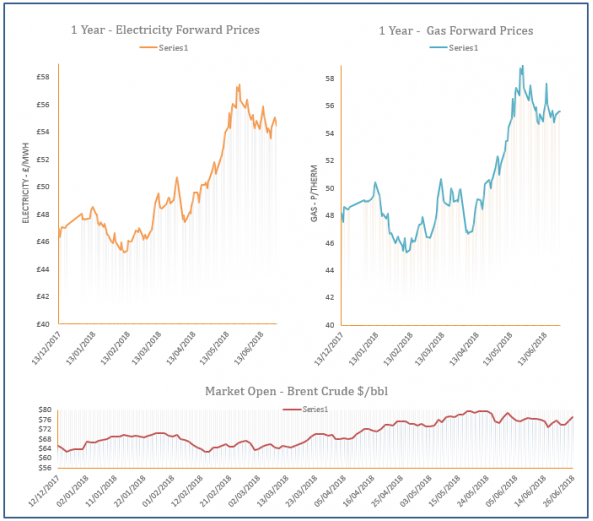
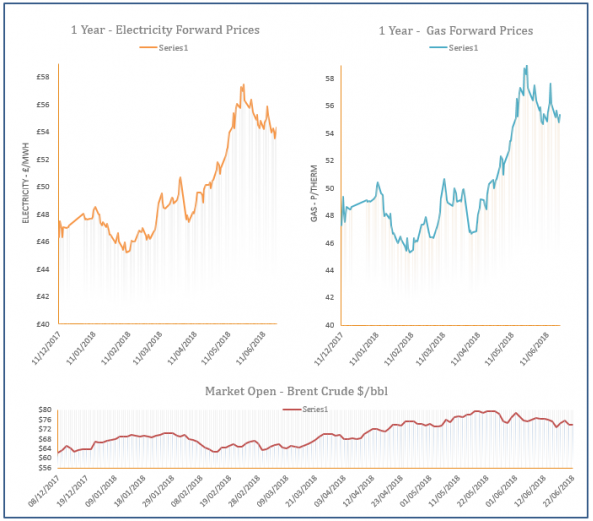
The analysis also contains a graph which tracks the one-year forward price of both gas and electricity as well as changes to Brent crude oil.

10 Reasons to Use a Utility Management Company
27th June 2018 | Posted by: Daniel Birkett | Industry News
Many businesses and organisations are unsure of how the services provided by a utility management company can benefit them. Not only, can these services lead to direct savings on your monthly energy bill but they can also free up valuable man hours.

Energy Market Analysis - 27-06-2018
27th June 2018 | Posted by: Daniel Birkett | Market Analysis
Gas prices displayed losses across the curve on Tuesday as the system was oversupplied due to low demand and improved flows from Norway. The warm weather outlook is set to continue into the weekend, which further weighed on the prompt. However, downward movement at the back of the curve was restricted by a bullish outlook for coal and oil.
Energy Market Analysis - 26-06-2018
26th June 2018 | Posted by: Daniel Birkett | Market Analysis
Gas prices displayed mixed movement yesterday with losses recorded at the front of the curve and gains further out. Warm weather continued to weigh on demand levels and Norwegian flows increased, contributing to a long system. Meanwhile, a sharp rise in oil prices was the cause behind upward movement at the back of the curve.

Energy Market Analysis - 25-06-2018
25th June 2018 | Posted by: Daniel Birkett | Market Analysis
Gas prices moved higher during Friday’s afternoon session with direction coming from the oil market, with the latest OPEC meeting the main market driver. Despite the afternoon gains, the overall context at the front of the curve was bearish with healthy wind levels reducing CCGT demand and Norwegian flows increasing following the end of planned outages.
Energy Market Analysis - 22-06-2018
22nd June 2018 | Posted by: Daniel Birkett | Market Analysis
Gas prices displayed mixed movement on Thursday with an expected rise in Norwegian & UKCS flows weighing on contracts at the front of the curve, whereas far-curve prices displayed small gains despite bearish fuel markets. Strong wind levels and mild weather reduced demand levels, resulting in an oversupplied system which in turn pressured down the prompt.