


Apollo Energy publishes a daily energy market analysis, focusing on the gas, power and oil markets including a commentary on how the markets close and open. Our analysis provides insight on how the markets are performing and also considers various factors which could dictate price changes in the future.
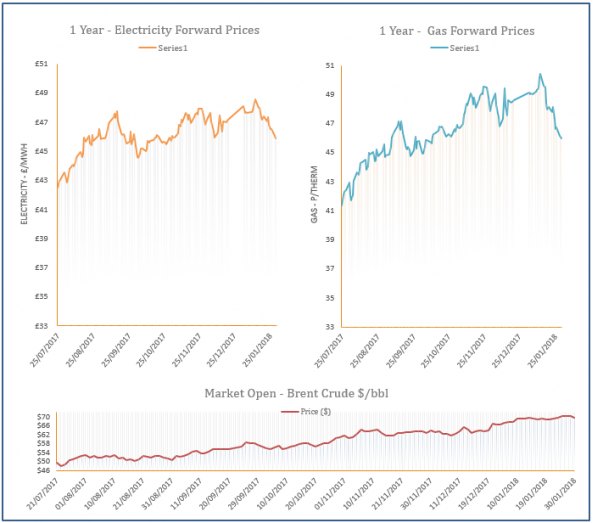
The analysis also contains a graph which tracks the one-year forward price of both gas and electricity as well as changes to Brent crude oil.

Energy Market Analysis - 31-01-2018
31st January 2018 | Posted by: Daniel Birkett | Market Analysis
Gas prices decreased on Tuesday with weak demand levels and falling commodity markets the main market drivers. The system was balanced but further unplanned outages in Norway offered some support to the prompt. The far-curve weakened as coal prices decreased due to Chinese workers agreeing to postpone holidays next month to avoid supply shortages.
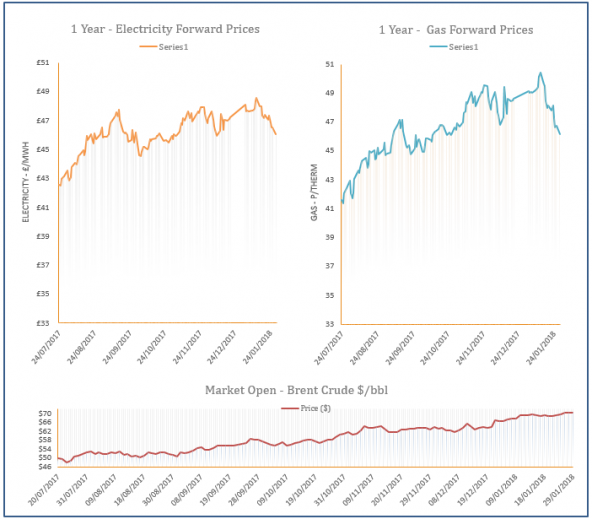
Energy Market Analysis - 30-01-2018
30th January 2018 | Posted by: Daniel Birkett | Market Analysis
Gas prices moved down yesterday afternoon despite an expected drop in temperatures and wind generation at the start of February. Improved Norwegian supply helped to weigh on the near-curve, while comfortable renewable power reduced CCGT demand. Contracts at the back of the curve also shed from their price and were dictated by losses on the coal and oil markets.
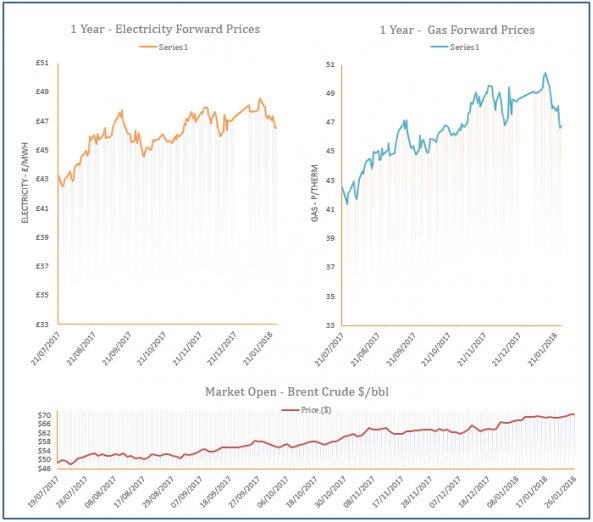
Energy Market Analysis - 29-01-2018
29th January 2018 | Posted by: Daniel Birkett | Market Analysis
Near-curve gas prices moved higher on Friday afternoon following a downward revision in temperatures for February. However, the prompt shed from its price as mild weather and healthy wind levels were expected to continue at the start of this week and Norwegian supply was set to improve. Further along the curve, most contracts moved down with little support provided by fuel markets.
Energy Market Analysis - 26-01-2018
26th January 2018 | Posted by: Daniel Birkett | Market Analysis
A weaker LDZ demand outlook in the short term continued to act as the main market driver for the near-gas curve yesterday and the majority of contracts stabilised. Meanwhile, the system was long despite further UKCS constraints and low Norwegian flows. Further out, prices displayed little movement as a bullish oil market provided support.
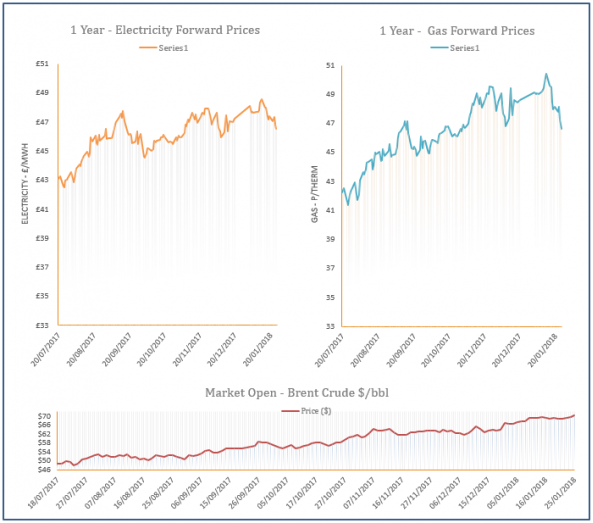
Energy Market Analysis - 25-01-2018
25th January 2018 | Posted by: Daniel Birkett | Market Analysis
Weaker demand levels are expected over the next week or so as temperatures are set to remain mild. UKCS production also increased as a number of outages were resolved, helping towards an oversupplied system. Further out, any bearish movement was limited by a strengthening oil market.