


Apollo Energy publishes a daily energy market analysis, focusing on the gas, power and oil markets including a commentary on how the markets close and open. Our analysis provides insight on how the markets are performing and also considers various factors which could dictate price changes in the future.
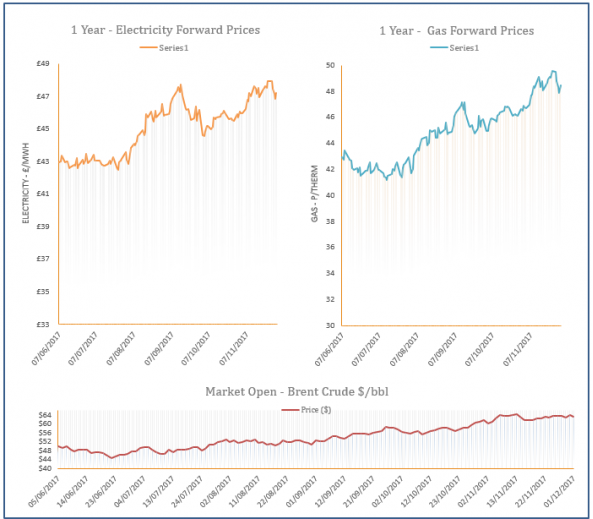
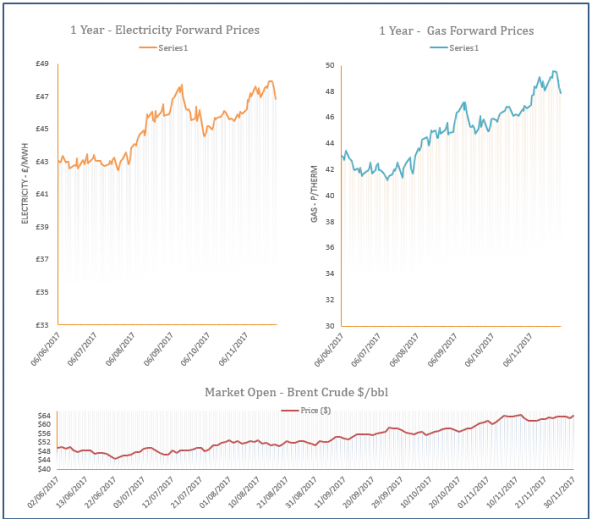
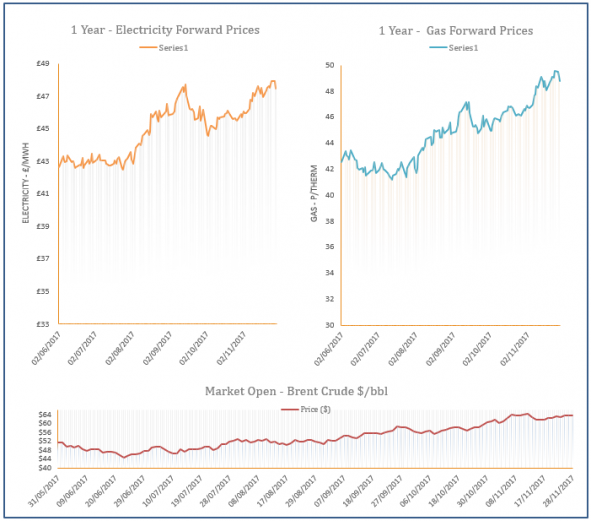
The analysis also contains a graph which tracks the one-year forward price of both gas and electricity as well as changes to Brent crude oil.

Oil producers agree to extend output cuts
1st December 2017 | Posted by: Daniel Birkett | Industry News
Oil prices have strengthened following yesterday’s meeting in Vienna which saw OPEC and non-OPEC oil producing nations agree to extend output cuts until the end of 2018.
Energy Market Analysis - 01-12-2017
1st December 2017 | Posted by: Daniel Birkett | Market Analysis
A milder weather outlook for next week helped to weigh on near-curve gas contracts during Thursday’s session. However, the current cold spell helped to lift the prompt as residential demand rose to its highest level since February. Movement further along the curve was generally bearish as coal and oil markets weakened and the Pound strengthened against the Euro.
Energy Market Analysis - 30-11-2017
30th November 2017 | Posted by: Daniel Birkett | Market Analysis
Gas prices displayed mixed movement yesterday with a long system weighing on near-curve contracts. An uncertain weather forecast limited some of the losses, while contracts further out followed stronger coal and oil markets. However, the Pound strengthened against the Euro as Brexit negotiations have progressed, capping some of the gains on the far-curve.

Energy Market Analysis - 29-11-2017
29th November 2017 | Posted by: Daniel Birkett | Market Analysis
Gas prices decreased during Tuesday’s session on the back of an oversupplied system and a slight upward revision in temperatures for next week. Supply levels were healthy and helped the system cope with a rise in demand, while bearish movement on the oil market helped to weigh on the far curve.
Energy Market Analysis - 28-11-2017
28th November 2017 | Posted by: Daniel Birkett | Market Analysis
Gas prices were bullish yesterday due to a sharp drop in temperatures which lifted residential demand. Wind levels were also forecast to decrease today with gas-fired power generation expected to make up the shortfall. The oil market was stable throughout the session, while coal prices moved down, providing little support to far-curve prices.