


Apollo Energy publishes a daily energy market analysis, focusing on the gas, power and oil markets including a commentary on how the markets close and open. Our analysis provides insight on how the markets are performing and also considers various factors which could dictate price changes in the future.
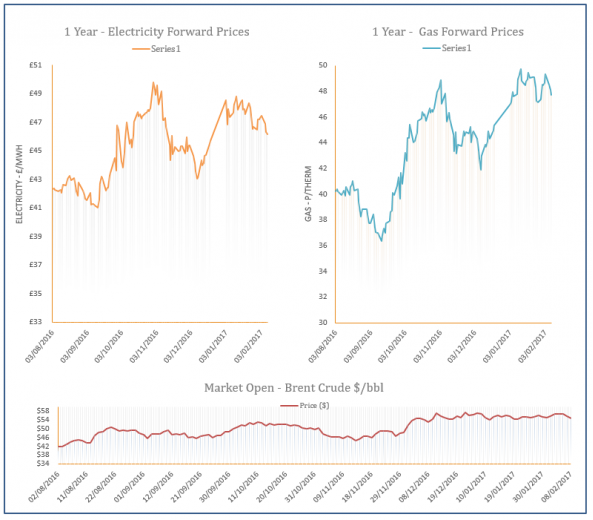
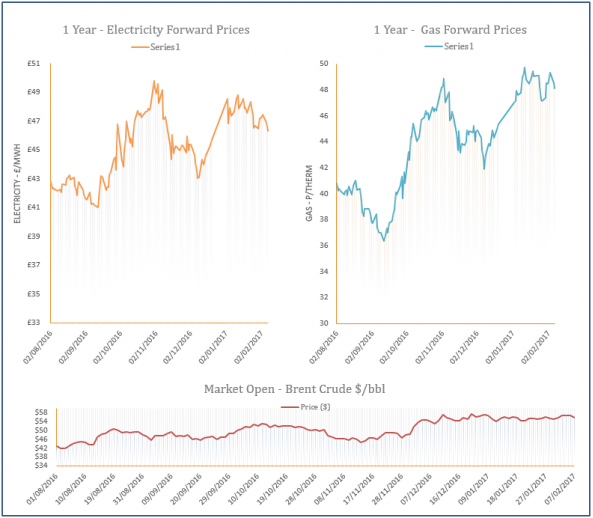
The analysis also contains a graph which tracks the one-year forward price of both gas and electricity as well as changes to Brent crude oil.

Energy Market Analysis - 13-02-2017
13th February 2017 | Posted by: Daniel Birkett | Market Analysis
Gas contracts moved down on Friday as the second half of February is expected to be mild, with a significant drop in demand expected today helping the prompt record a loss. Outages at the Rough and Bergermeer storage facilities failed to offer much support, although an increase in Brent helped to limit downward movement on the far-curve.

Energy Market Analysis - 10-02-2017
10th February 2017 | Posted by: Daniel Birkett | Market Analysis
Near curve gas prices decreased yesterday as temperatures across Europe are set to turn milder next week which will reduce demand levels. However, the losses were smaller than previous sessions as demand was set to peak today and UKCS and Norwegian flows were limited by unplanned outages, while coal and gas markets also ticked higher.

Energy Market Analysis - 09-02-2017
9th February 2017 | Posted by: Daniel Birkett | Market Analysis
A warmer weather outlook continued to pressure down gas contracts yesterday as demand levels will decline over the next couple of weeks; a stronger Pound also helped to weigh on prices. The bearish movement was more evident at the front of the curve as losses further out were limited by a rebound in oil contacts.
Energy Market Analysis - 08-02-2017
8th February 2017 | Posted by: Daniel Birkett | Market Analysis
The weather forecast for next week is set to be milder than initially expected which helped towards losses on near gas curve on Tuesday. An LNG delivery from Peru is also set to arrive in the UK before the end of the month which further weighed on prices. Meanwhile, movement further along the curve was less visible as stronger coal prices limited any decreases.
Energy Market Analysis - 07-02-2017
7th February 2017 | Posted by: Daniel Birkett | Market Analysis
Gas prices moved down on Monday, shaving off some of the significant gains which were recorded last week. Weakening coal and oil markets helped to weigh on the far-curve, while improved Norwegian supply and an expected rise in temperatures later in the month contributed to losses at the front of the curve.