


Apollo Energy publishes a daily energy market analysis, focusing on the gas, power and oil markets including a commentary on how the markets close and open. Our analysis provides insight on how the markets are performing and also considers various factors which could dictate price changes in the future.
The analysis also contains a graph which tracks the one-year forward price of both gas and electricity as well as changes to Brent crude oil.
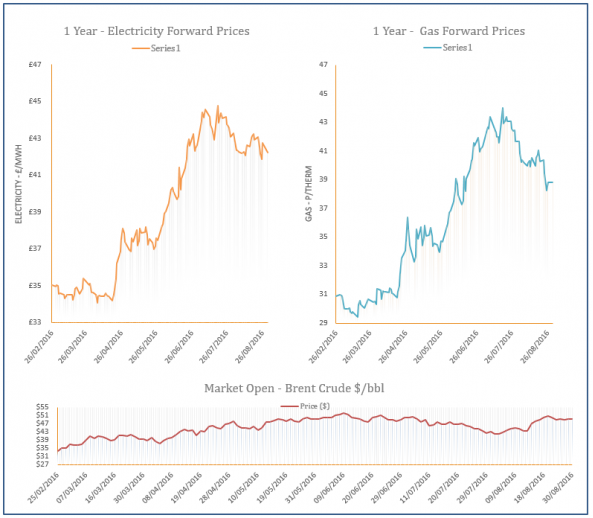
Energy Market Analysis - 30-08-2016
30th August 2016 | Posted by: Daniel Birkett | Market Analysis
Gas contracts moved higher on Friday ahead of planned maintenance work at Norwegian facilities which will limit imports into the UK. A rebound in oil prices also offered additional support further along the curve, while movement on the prompt was limited by a weaker demand forecast over the bank holiday.
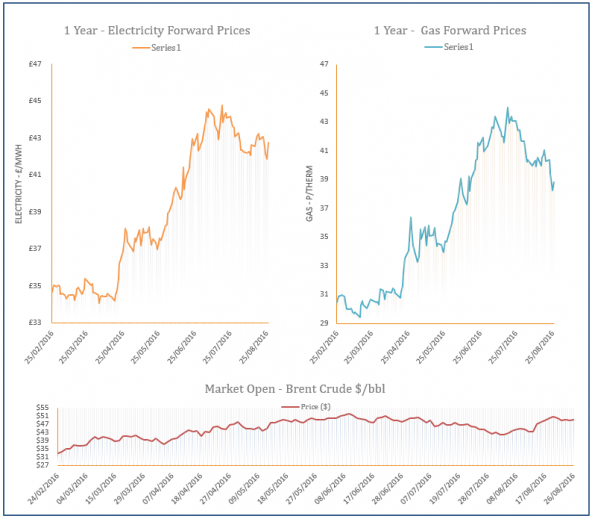
Energy Market Analysis - 26-08-2016
26th August 2016 | Posted by: Daniel Birkett | Market Analysis
Gas contracts initially opened higher yesterday due to a comfortable gas system and a weaker demand forecast for the Bank Holiday weekend. However, prices gradually rose throughout the session due to an increase in Brent, a weakening Pound and a drop in Norwegian flows.

Market Update - DSBR cancelled for winter 2016
26th August 2016 | Posted by: Daniel Birkett | Industry News
The National Grid has decided to cancel Demand Side Balancing Reserve (DSBR) for the winter 2016 period as it was confirmed that minimal volume would be available at that time.
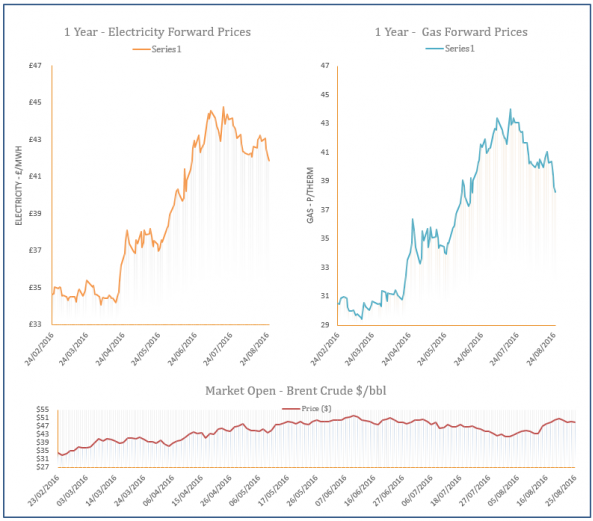
Energy Market Analysis - 25-08-2016
25th August 2016 | Posted by: Daniel Birkett | Market Analysis
Improved supply levels helped to weigh on near-curve gas prices on Wednesday, with higher Norwegian flows into Europe and an increase in LNG send-outs in the UK, with several deliveries expected before the end of August. Contracts further along the curve remained bearish with falling oil the main market driver.
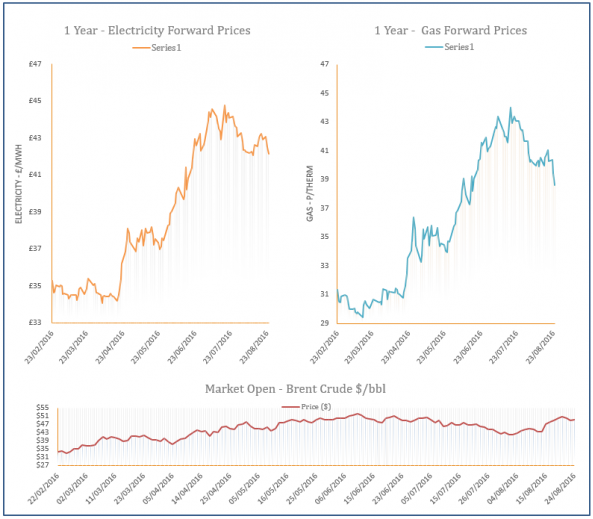
Energy Market Analysis - 24-08-2016
24th August 2016 | Posted by: Daniel Birkett | Market Analysis
Prompt gas contracts were supported by an increase in gas-fired power generation and a rise in exports to Belgium. Maintenance at the Mallnow entry point limited Russian gas flows into Europe which tightened gas systems on the continent, with Norwegian imports also lower than previous sessions. Further along the curve, movement was generally bearish with Monday’s news in regards to Rough’s withdrawal rate continuing to influence the Winter-16 contract.