


Apollo Energy publishes a daily energy market analysis, focusing on the gas, power and oil markets including a commentary on how the markets close and open. Our analysis provides insight on how the markets are performing and also considers various factors which could dictate price changes in the future.
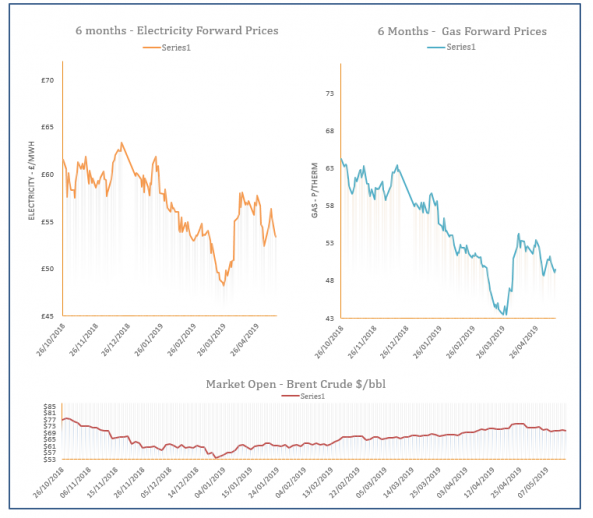
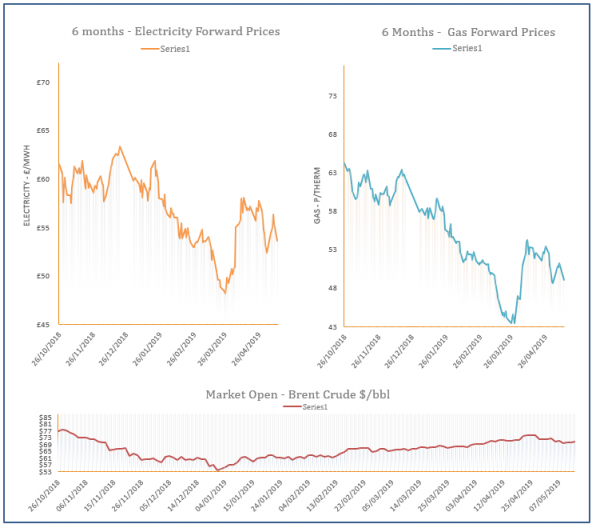
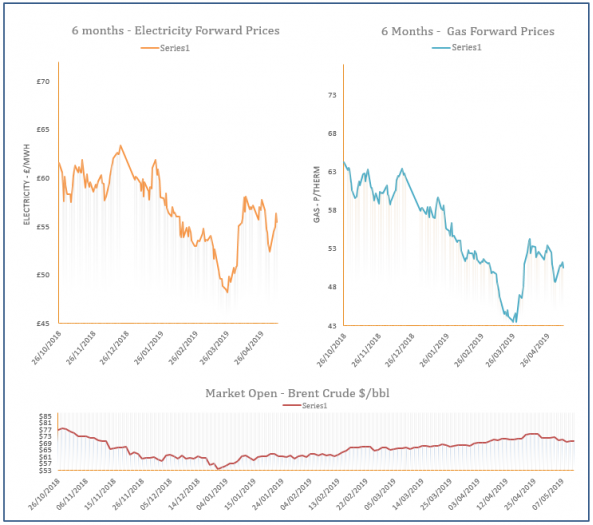
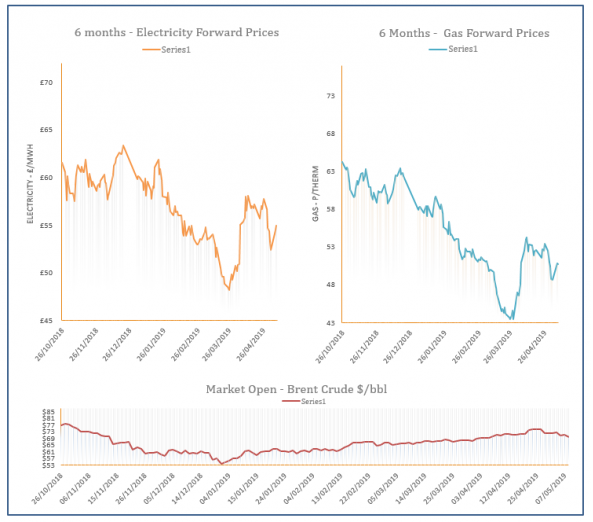
The analysis also contains a graph which tracks the one-year forward price of both gas and electricity as well as changes to Brent crude oil.
Energy Market Analysis - 14-05-2019
14th May 2019 | Market Analysis
Crude oil contracts on Monday continued to trade lower, driven by lower demand caused by milder than expected weather. This combined with a healthy supply outlook as a further six LNG vessels are due to arrive before the end of May, provided a bearish outlook as gas markets closed yesterday.
Energy Market Analysis - 13-05-2019
13th May 2019 | Posted by: Lawrence Carson | Market Analysis
After a volatile week, gas prices fell on Friday. Rising temperatures and a change in the supply/demand balance were the reasons for the downward correction, leaving the gas system oversupplied.
Energy Market Analysis - 10-05-2019
10th May 2019 | Market Analysis
The longer dated contracts traded lower yesterday, this is following a weakening of the carbon market which began reversing its session-on-session gains. Further downside was added as the Cal 20 coal contract softened over the duration of the day.

Energy Market Analysis - 09-05-2019
9th May 2019 | Posted by: Lawrence Carson | Market Analysis
The majority of gas contracts made gains across the curve yesterday. Cold temperatures, lower power production from wind and rallying carbon prices were all responsible for pushing gas prices higher.
Energy Market Analysis - 08-05-2019
8th May 2019 | Posted by: Natalie Ormrod | Market Analysis
Trade on Gas was mixed yesterday with an early morning rally, by the afternoon the market turned which saw lower front curve and spot prices due to increasing wind output, rising temperatures and strength in Carbon.