


Apollo Energy publishes a daily energy market analysis, focusing on the gas, power and oil markets including a commentary on how the markets close and open. Our analysis provides insight on how the markets are performing and also considers various factors which could dictate price changes in the future.
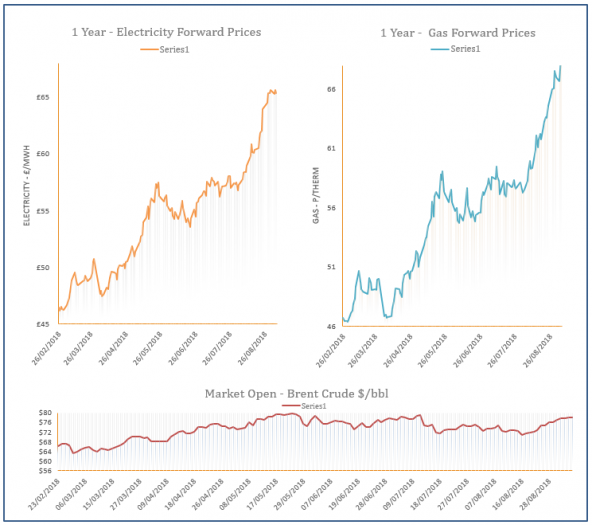
The analysis also contains a graph which tracks the one-year forward price of both gas and electricity as well as changes to Brent crude oil.
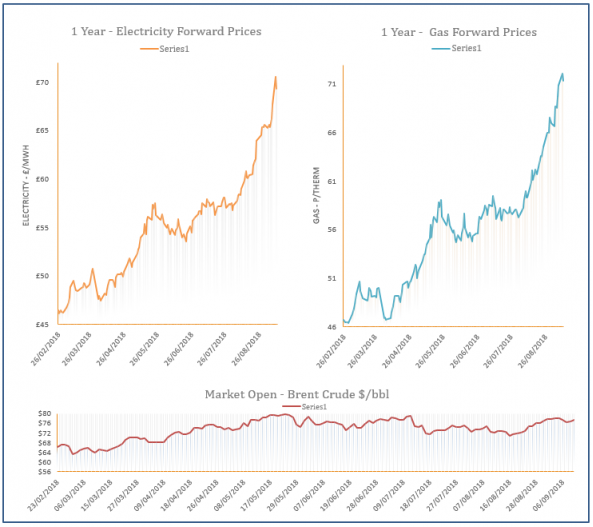
Energy Market Analysis – 11-09-2018
11th September 2018 | Posted by: Lawrence Carson | Market Analysis
With a comfortable supply, European spot power prices should push lower today. Further out, profit taking could potentially end the rally and drive Cal 2019 power prices lower.
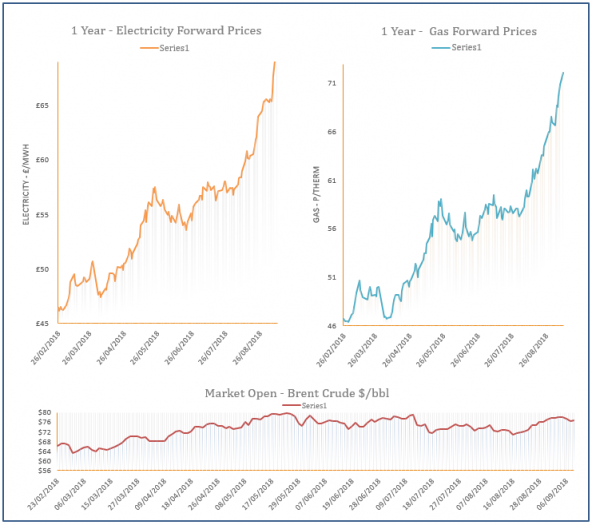
Energy Market Analysis – 10-09-2018
10th September 2018 | Posted by: Lawrence Carson | Market Analysis
A further increase in EUA prices meant European gas prices continued to rally on Friday. Concerns over low stock levels continued to add support to winter 18 prices.
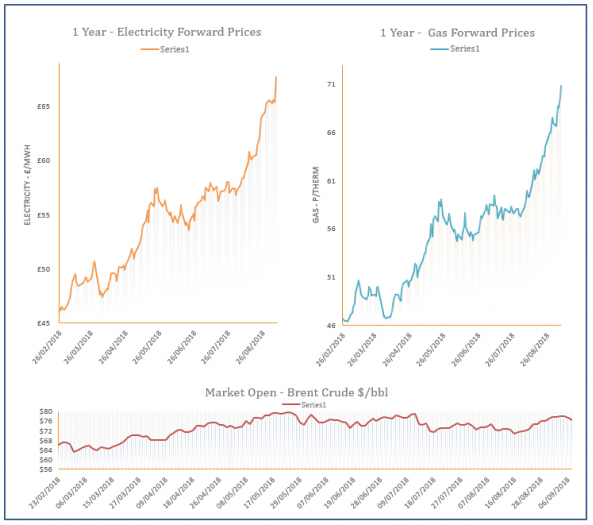
Energy Market Analysis – 07-09-2018
7th September 2018 | Posted by: Lawrence Carson | Market Analysis
On the far curve, CO2 prices made a major comeback which was likely technical since they have retracted all the losses of the past week. It was also backed by bullish coal prices.
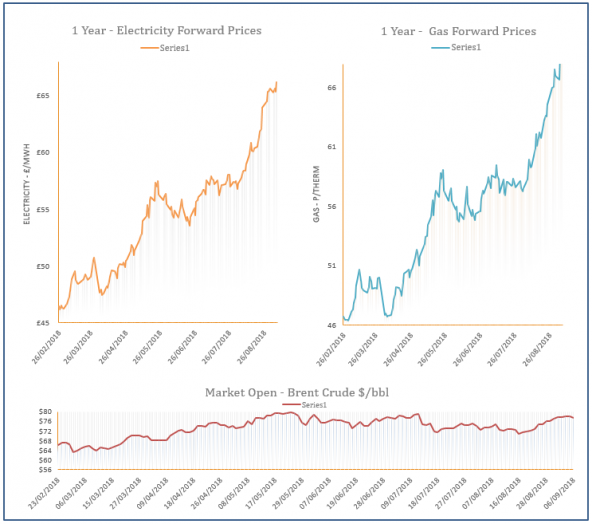
Energy Market Analysis – 06-09-2018
6th September 2018 | Posted by: Lawrence Carson | Market Analysis
With slightly more wind and nuclear power, spot prices were seen a little lower. Further out, power prices rose to new highs with a strong increase in coal prices.
Energy Market Analysis – 05-09-2018
5th September 2018 | Posted by: Lawrence Carson | Market Analysis
An undersupplied UK system for a second day in a row gave a boost to NBP spot prices. However a late drop in Brent prices curbed early gains towards the close.