


Apollo Energy publishes a daily energy market analysis, focusing on the gas, power and oil markets including a commentary on how the markets close and open. Our analysis provides insight on how the markets are performing and also considers various factors which could dictate price changes in the future.
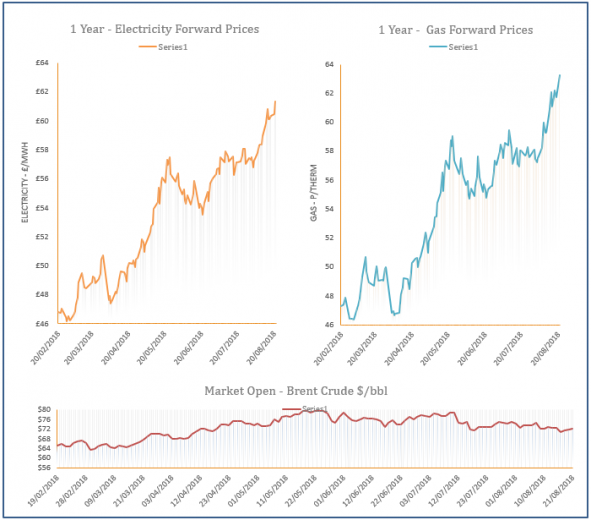
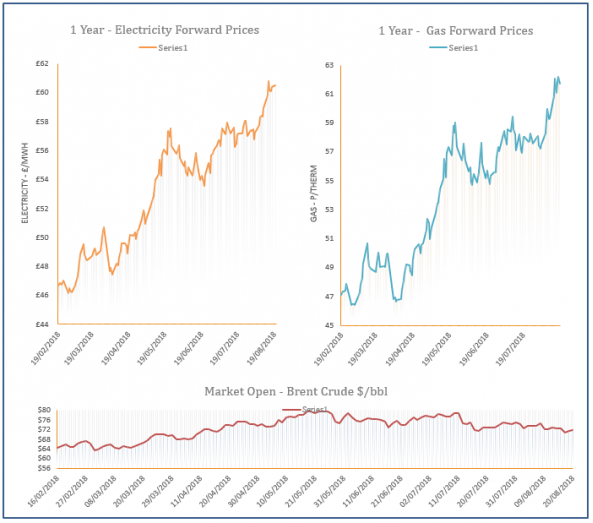
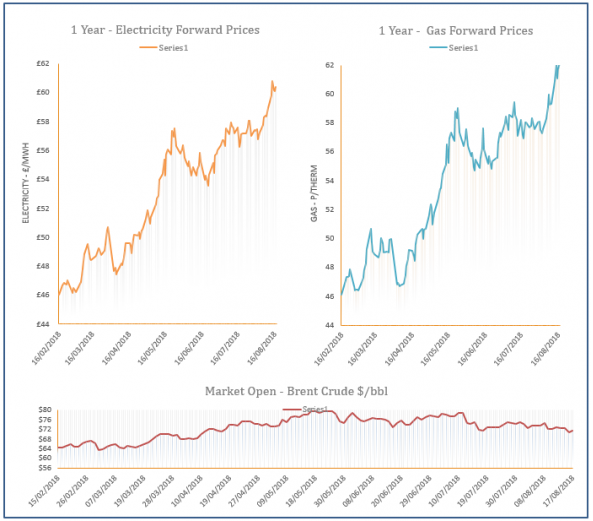
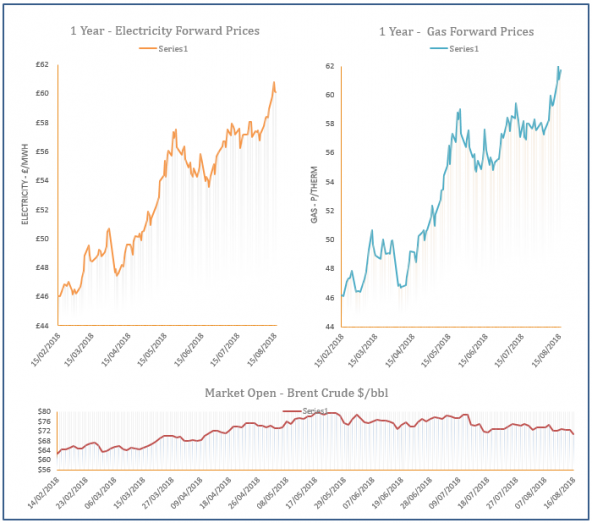
The analysis also contains a graph which tracks the one-year forward price of both gas and electricity as well as changes to Brent crude oil.
Energy Market Analysis - 21-08-2018
21st August 2018 | Posted by: Daniel Birkett | Market Analysis
Gas prices moved down yesterday morning but a rebound on oil & coal markets, in addition to two unplanned outages helped contracts to recover in the afternoon. The system opened long despite planned maintenance and a worker’s strike limiting flows into the UK; this helped to weigh on the near-curve at the start of the session.
Energy Market Analysis - 20-08-2018
20th August 2018 | Posted by: Daniel Birkett | Market Analysis
Near-curve gas prices were bullish on Friday due to planned maintenance at Norwegian facilities which has limited flows via the Langeled pipeline into the UK. A strike by Total employees was also set to take place today, impacting production levels in the UKCS, while stronger coal offered support to the far-curve.
Energy Market Analysis - 17-08-2018
17th August 2018 | Posted by: Daniel Birkett | Market Analysis
Maintenance at Kollsnes is scheduled to begin today which will reduce Norwegian flows by 20mcm, with a further decrease expected next week. Another Norwegian facility will also be undergoing maintenance over the same time period and this helped gas prices climb higher on Thursday, with bullish oil also a factor.
Energy Market Analysis - 16-08-2018
16th August 2018 | Posted by: Daniel Birkett | Market Analysis
Gas prices eased down yesterday as commodity markets weakened; oil prices decreased due to a rise in US crude stocks, while coal was pressured down by Chinese demand fears. However, low LNG send-outs and planned outages in Norway limited some of the losses on the near-curve.

Flex providers encouraged to sell into the Balancing Mechanism
16th August 2018 | Posted by: Daniel Birkett | Industry News
The new roadmap allows flexible participants to sell into the BM by altering the generation and consumption levels of their assets. Bids are placed in flexibility to half hour settlement periods, the Grid then purchases what it needs to balance the system.