


Apollo Energy publishes a daily energy market analysis, focusing on the gas, power and oil markets including a commentary on how the markets close and open. Our analysis provides insight on how the markets are performing and also considers various factors which could dictate price changes in the future.
The analysis also contains a graph which tracks the one-year forward price of both gas and electricity as well as changes to Brent crude oil.

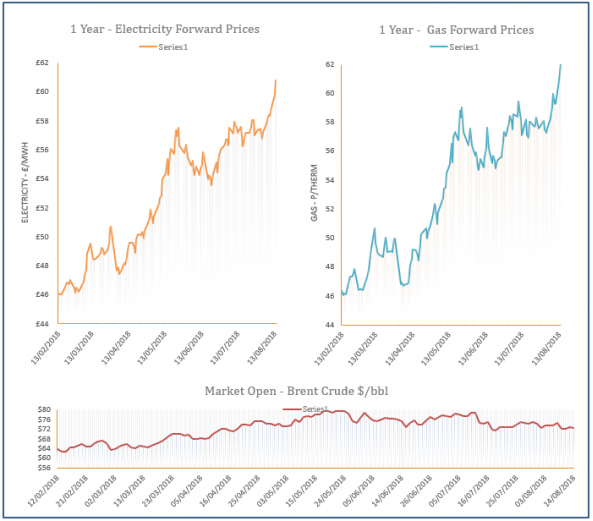
Energy Market Analysis – 15-08-2018
15th August 2018 | Posted by: Daniel Birkett | Market Analysis
Gas contracts increased yesterday with support provided by a bullish overall energy complex. A drop in Norwegian and Russian supply into Europe also provided support to the front of the curve. However, gains were limited in the afternoon due to a slight drop in oil.
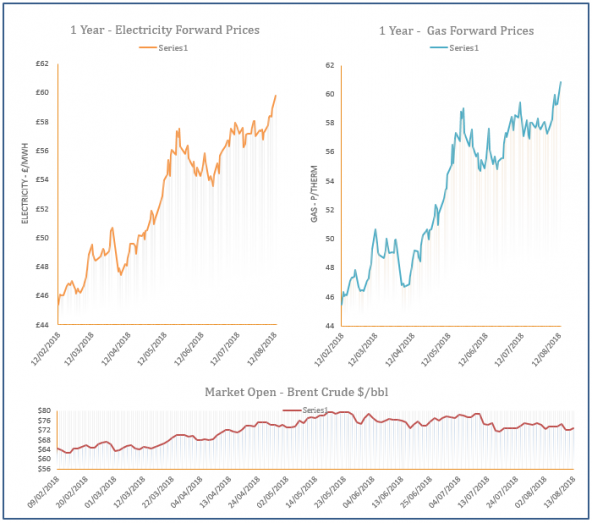
Energy Market Analysis - 14-08-2018
14th August 2018 | Posted by: Daniel Birkett | Market Analysis
Gas prices increased on Monday, reaching new highs on the back of a bullish coal market and reduced supply levels. Planned maintenance has led to supply constraints in Europe and a number of LNG deliveries are expected to make up the shortfall. Stronger oil prices also remained a supportive factor at the back of the curve.
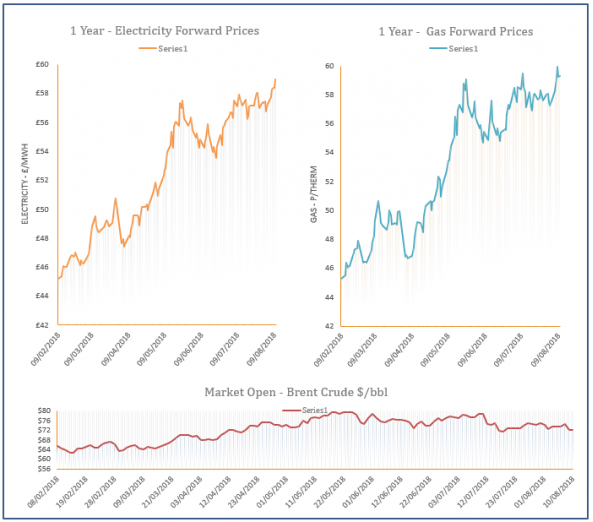
Energy Market Analysis - 13-08-2018
13th August 2018 | Posted by: Daniel Birkett | Market Analysis
Gas prices inched higher on Friday with support provided by stronger coal and oil markets, as overall fundamentals were little changed. Supply levels were comfortable which capped gains at the front of the curve, although maintenance is scheduled in Norway this week which will provide bullish sentiment.
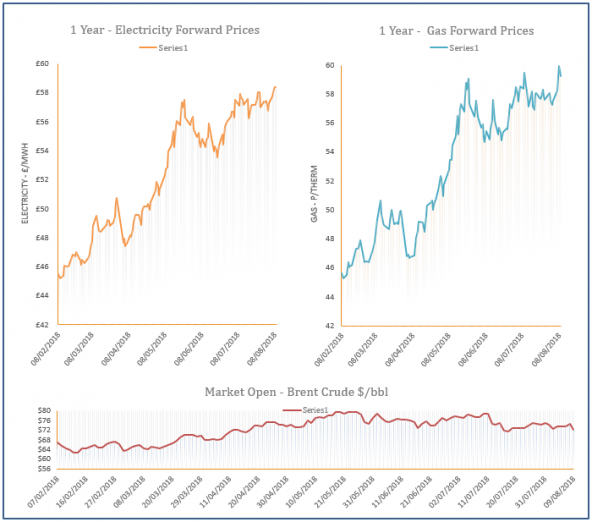
Energy Market Analysis - 10-08-2018
10th August 2018 | Posted by: Daniel Birkett | Market Analysis
Gas prices stabilised yesterday as movement on the oil market calmed, providing little direction to the curve. The supply/ demand picture was almost unchanged but a healthier renewable outlook should reduce CCGT demand over the next few days, weighing on the near-curve.
Energy Market Analysis - 09-08-2018
9th August 2018 | Posted by: Daniel Birkett | Market Analysis
The latest EIA report resulted in weaker oil prices yesterday afternoon which transferred to the gas curve, with a significant drop in coal prices also a contributing factor. The prompt erased its morning gains and ended the session almost unchanged, with an expected rise in supply via Bacton SEAL helping to weigh on the near-curve.