


Apollo Energy publishes a daily energy market analysis, focusing on the gas, power and oil markets including a commentary on how the markets close and open. Our analysis provides insight on how the markets are performing and also considers various factors which could dictate price changes in the future.
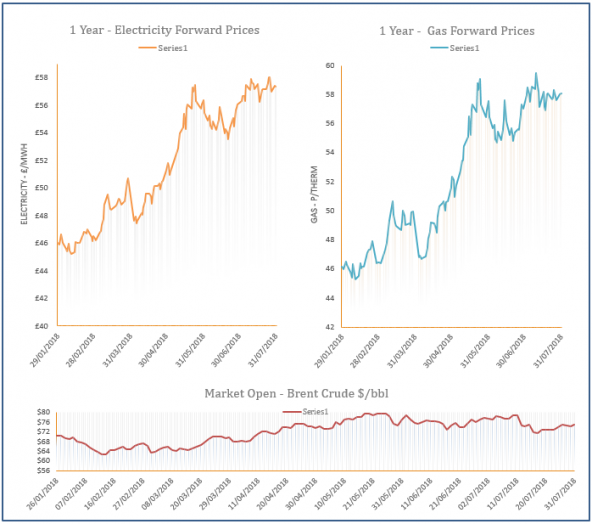
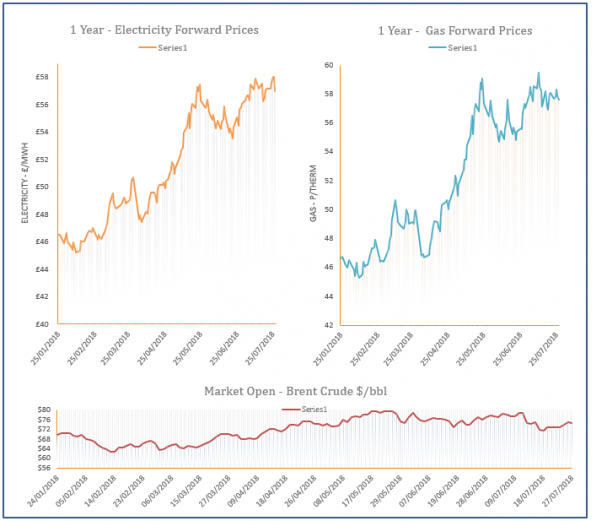
The analysis also contains a graph which tracks the one-year forward price of both gas and electricity as well as changes to Brent crude oil.

Energy Market Analysis - 02-08-2018
2nd August 2018 | Posted by: Daniel Birkett | Market Analysis
Gas prices displayed losses across the curve on Wednesday with a significant drop in oil and coal prices sparking bearish movement on the far-curve. Whereas the front of the curve was dictated by an oversupplied system and a warm weather forecast.

Energy Market Analysis - 01-08-2018
1st August 2018 | Posted by: Daniel Birkett | Market Analysis
Gas prices eased down during yesterday’s session as the UK gas system was oversupplied and oil contracts decreased in value. Improved wind levels reduced CCGT demand, while warm temperatures kept LDZ demand low. Russian flows into Europe also increased, helping to weigh on markets across the continent.
Energy Market Analysis - 31-07-2018
31st July 2018 | Posted by: Daniel Birkett | Market Analysis
Gas prices moved higher on Monday with the larger increases displayed at the front of the curve. Fundamentals were little changed from last week, although wind levels improved, weighing on CCGT demand. Meanwhile, oil posted a small gain and the Pound weakened, providing bullish sentiment to the curve.

Energy Market Analysis - 30-07-2018
30th July 2018 | Posted by: Daniel Birkett | Market Analysis
Gas prices were slightly bearish on Friday with little support provided by fuel markets. Improved renewable levels were expected over the weekend and the start of this week which will weigh on CCGT demand, helping the prompt move down.
Energy Market Analysis - 27-07-2018
27th July 2018 | Posted by: Daniel Birkett | Market Analysis
Gas prices moved down across Europe as the overall energy complex was bearish. Warm temperatures are set to continue over the coming weeks which will keep residential demand low, while a slight increase in wind levels weighed on CCGT demand.