


Apollo Energy publishes a daily energy market analysis, focusing on the gas, power and oil markets including a commentary on how the markets close and open. Our analysis provides insight on how the markets are performing and also considers various factors which could dictate price changes in the future.
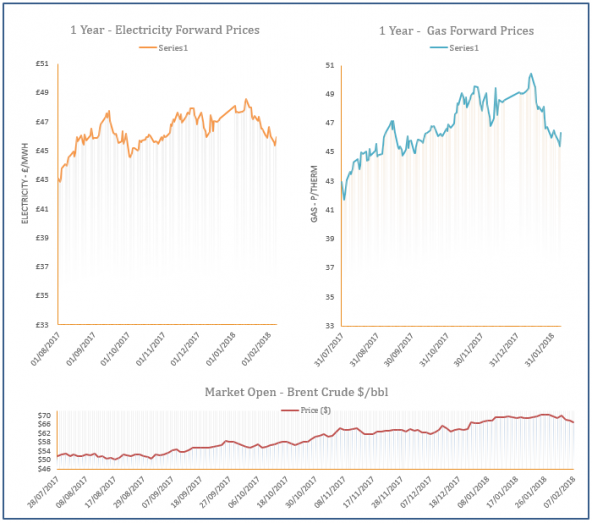
The analysis also contains a graph which tracks the one-year forward price of both gas and electricity as well as changes to Brent crude oil.
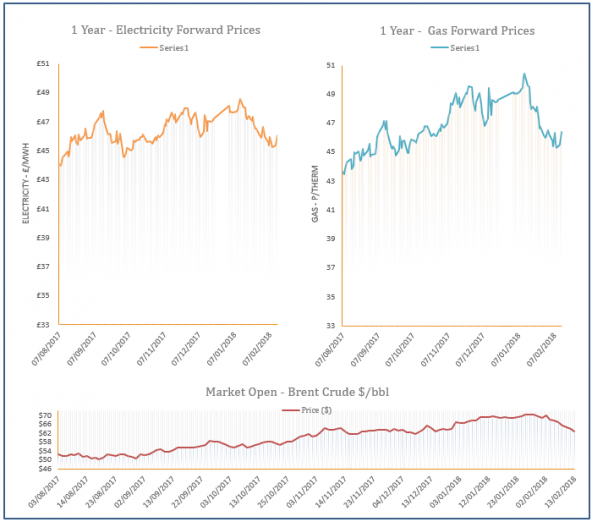
Energy Market Analysis - 13-02-2018
13th February 2018 | Posted by: Daniel Birkett | Market Analysis
Gas prices increased yesterday despite milder temperatures and improved wind generation which reduced demand. Bullish sentiment was provided by a cold weather outlook for next week and an outage at the Troll processing facility which will impact Norwegian flows into the UK. Meanwhile, a rise in coal prices helped to lift the far-curve, ignoring a weakening oil market.
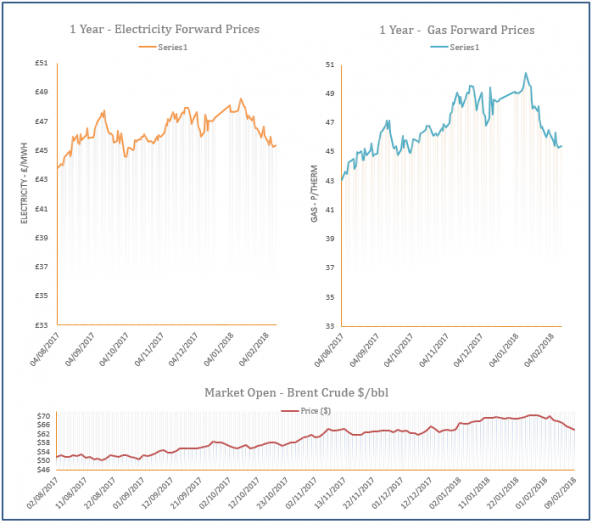
Energy Market Analysis - 12-02-2018
12th February 2018 | Posted by: Daniel Birkett | Market Analysis
Cold weather and an outage at the Forties pipeline meant the system was slightly short on Friday, offering support to prices at the front of the curve. An improved weather outlook for this week helped to provide some bearish resistance, while contracts on the far-curve stabilised due to weakening oil prices.
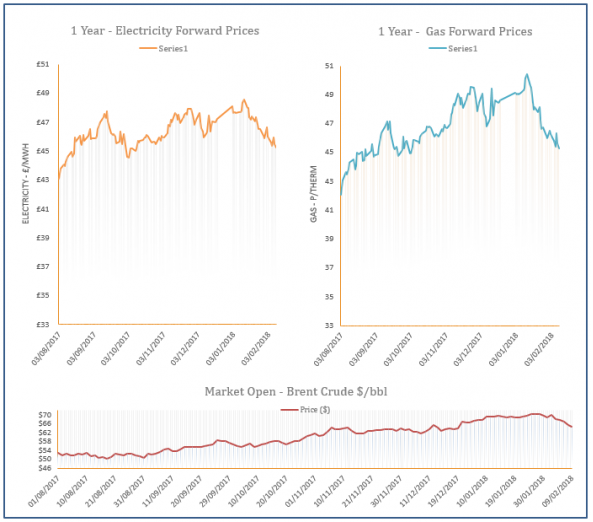
Energy Market Analysis - 09-02-2018
9th February 2018 | Posted by: Daniel Birkett | Market Analysis
Gas prices moved down on Thursday with direction provided by an expected rise in temperatures next week which will reduce residential demand. Healthy wind levels are also forecast, resulting in lower gas-fired power demand which provided further downward pressure. Meanwhile, oil prices displayed a strong decline which transferred to contracts at the back of the curve.
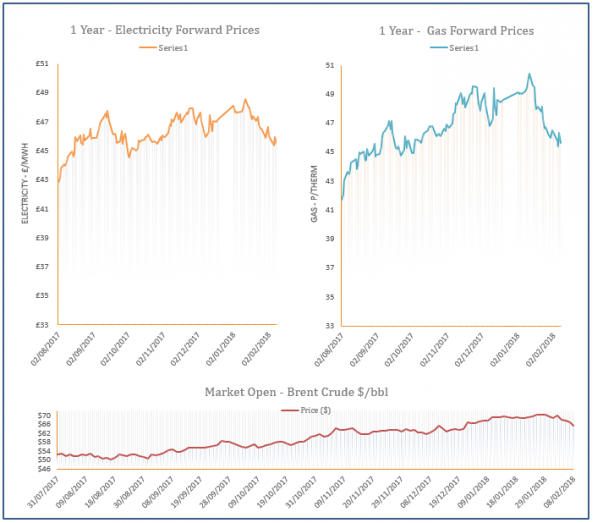
Energy Market Analysis - 08-02-2018
8th February 2018 | Posted by: Daniel Birkett | Market Analysis
Near-curve gas contracts increased in price on Wednesday with direction coming from cold temperatures which have lifted demand and tightened systems. An unplanned outage at the Forties pipeline also affected gas supply, providing additional support. Meanwhile, oil prices dropped in the afternoon and this helped to weigh on some far-curve contracts later in the session.
Energy Market Analysis - 07-02-2018
7th February 2018 | Posted by: Daniel Birkett | Market Analysis
The system tightened yesterday due to cold temperatures, resulting in bullish movement across the near-curve. Gains were also visible on the far-curve but the upward movement was capped by falling coal and oil markets. However, coal prices could increase significantly if Colombian workers go on strike due to a wage dispute.