


Apollo Energy publishes a daily energy market analysis, focusing on the gas, power and oil markets including a commentary on how the markets close and open. Our analysis provides insight on how the markets are performing and also considers various factors which could dictate price changes in the future.
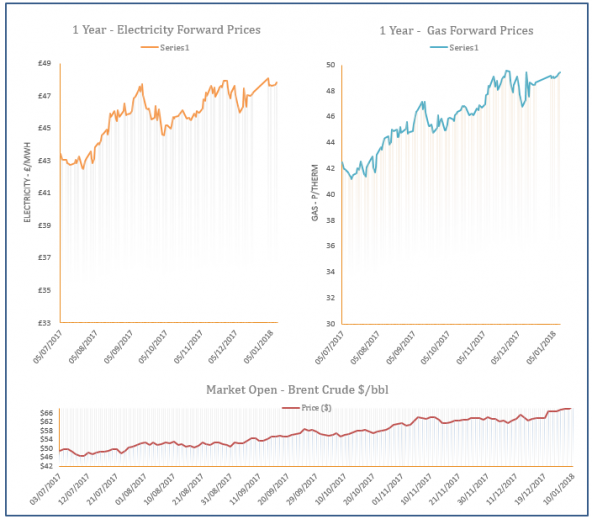
The analysis also contains a graph which tracks the one-year forward price of both gas and electricity as well as changes to Brent crude oil.
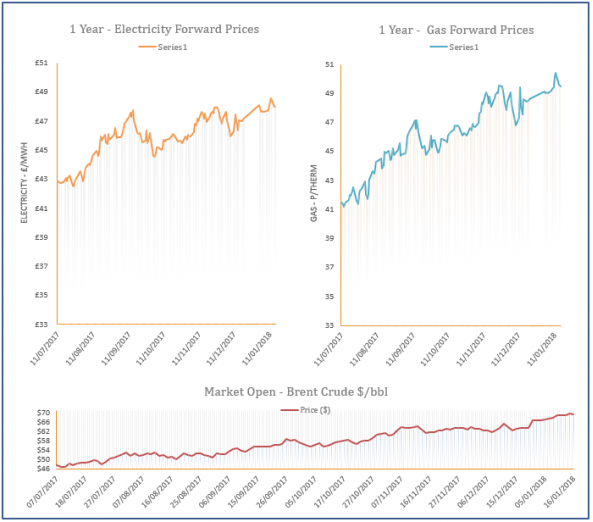
Energy Market Analysis - 16-01-2018
16th January 2018 | Posted by: Daniel Birkett | Market Analysis
A milder weather outlook for the remainder of January helped to apply bearish pressure across the near gas curve yesterday. Wind levels were also set to remain high today, weighing on the prompt as gas-fired generation was forecast to fall. Movement further along the curve was generally stable as coal and oil markets were almost unchanged.
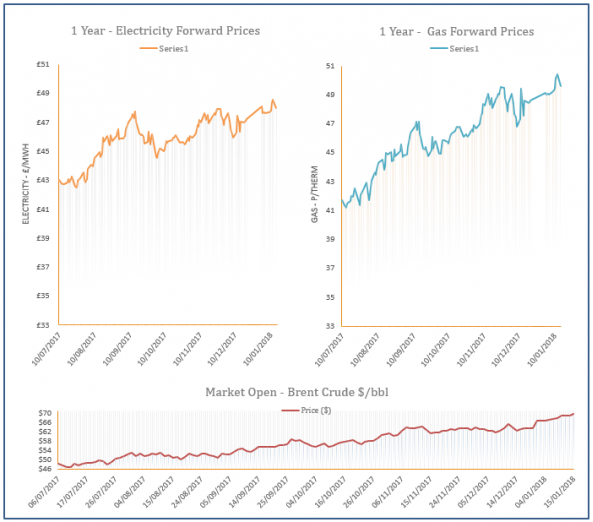
Energy Market Analysis - 15-01-2018
15th January 2018 | Posted by: Daniel Birkett | Market Analysis
Gas prices moved higher on Friday as temperature forecasts were revised down for the next couple of weeks which will lead to a rise in residential demand. Production at the Groningen facility in Holland was also reduced, with further sanctions a possibility following the recent earthquake. Meanwhile, far-curve contracts continued to find support from a bullish oil market.
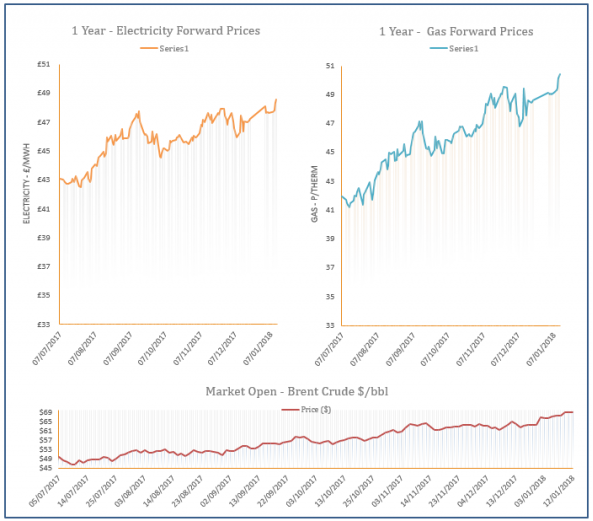
Energy Market Analysis - 12-01-2018
12th January 2018 | Posted by: Daniel Birkett | Market Analysis
Wind levels were expected to rise today which will reduce the need for gas-fired power generation, helping Day-Ahead gas decrease yesterday. Cold temperatures are set to hit the UK next week which fuelled bullish sentiment on the rest of the near curve. At the back of the curve, the majority of contracts were pushed higher by rising Brent and a weaker Pound.
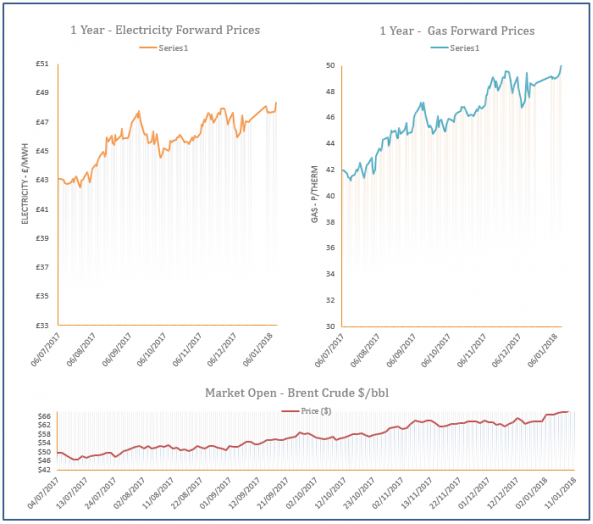
Energy Market Analysis - 11-01-2018
11th January 2018 | Posted by: Daniel Birkett | Market Analysis
Gas prices strengthened throughout yesterday’s session as it was confirmed that some constraints would be placed on production at the Groningen facility in Holland. An expected drop in temperatures today and low wind levels also offered further support at the front of the curve, while rising Brent provided bullish pressure on the far-curve.
Energy Market Analysis - 10-01-2018
10th January 2018 | Posted by: Daniel Birkett | Market Analysis
High demand helped towards gains on the near gas curve yesterday, with on-going support provided by the earthquake near Groningen which has affected production. An expected drop in wind generation today also contributed to upward movement on the prompt. Further out, prices continued to find support from a bullish oil market.