


Apollo Energy publishes a daily energy market analysis, focusing on the gas, power and oil markets including a commentary on how the markets close and open. Our analysis provides insight on how the markets are performing and also considers various factors which could dictate price changes in the future.
The analysis also contains a graph which tracks the one-year forward price of both gas and electricity as well as changes to Brent crude oil.
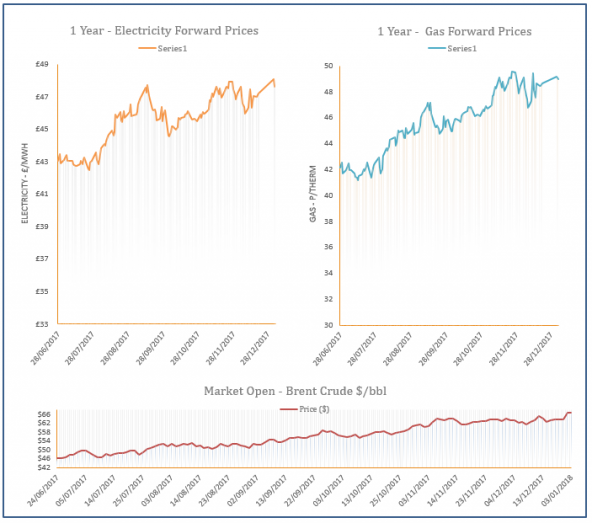
Energy Market Analysis - 03-01-2018
3rd January 2018 | Posted by: Daniel Birkett | Market Analysis
Gas prices moved down during yesterday’s session as milder weather is expected over the coming days and supply levels are comfortable. UKCS has recovered as the Forties pipeline was expected to be fully operational today, resulting in a long system. However, downward movement further along the curve was limited by stronger coal and oil markets.

Repairs completed at Forties pipeline
3rd January 2018 | Posted by: Daniel Birkett | Industry News
The Forties pipeline is back online as maintenance work has been carried out to repair a crack, halting oil and gas production in the North Sea and causing a rise in energy prices prior to Christmas.
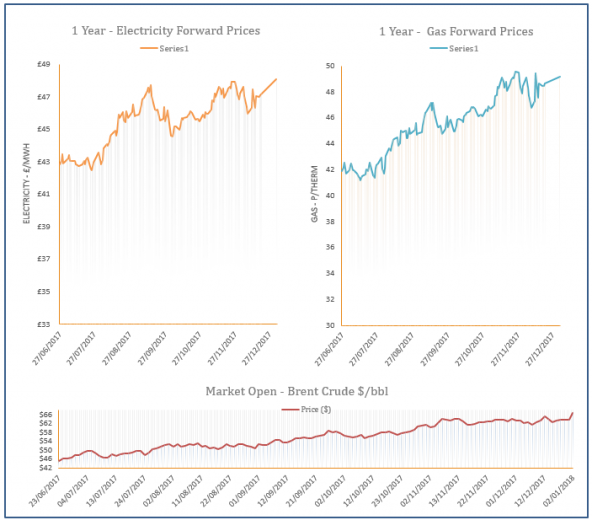
Energy Market Analysis - 02-01-2018
2nd January 2018 | Posted by: Daniel Birkett | Market Analysis
Day-Ahead gas opened unchanged at the start of yesterday’s session but quickly lost value thanks to a long system. Improved UKCS production helped towards the oversupply, with flows via the IUK pipeline also strong. High LDZ demand limited losses on the near-curve, while a rise in coal prices continued to lift some contracts further out.
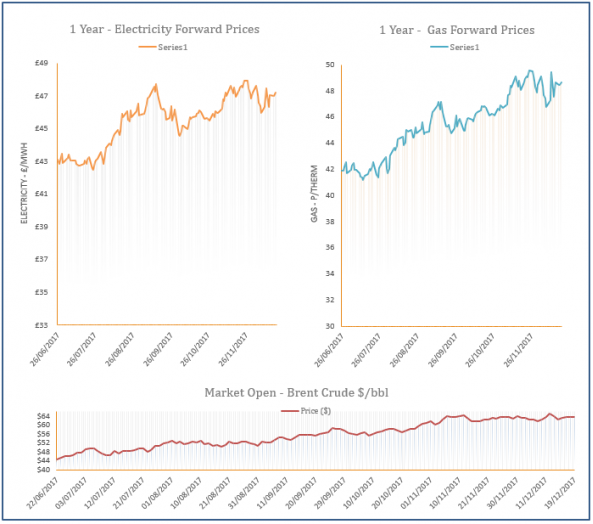
Energy Market Analysis - 20-12-2017
20th December 2017 | Posted by: Daniel Birkett | Market Analysis
Near-curve gas prices displayed losses yesterday as temperatures are expected to rise above the seasonal norm over the next few days and wind levels have increased slightly; resulting in weaker LDZ and CCGT demand. Meanwhile, movement at back of the curve was minimal due to a stable session for both coal and oil markets.
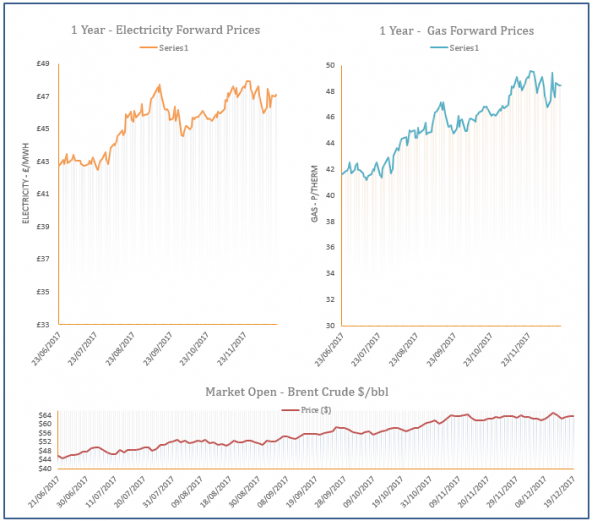
Energy Market Analysis - 19-12-2017
19th December 2017 | Posted by: Daniel Birkett | Market Analysis
A milder weather outlook for the rest of December continued to dictate the near gas curve yesterday as demand levels are set to decrease. Overall movement was bearish despite a tight system caused by the halt in UKCS production. Further out, a rise in coal prices capped some of the losses, while oil was almost unchanged.