


Apollo Energy publishes a daily energy market analysis, focusing on the gas, power and oil markets including a commentary on how the markets close and open. Our analysis provides insight on how the markets are performing and also considers various factors which could dictate price changes in the future.
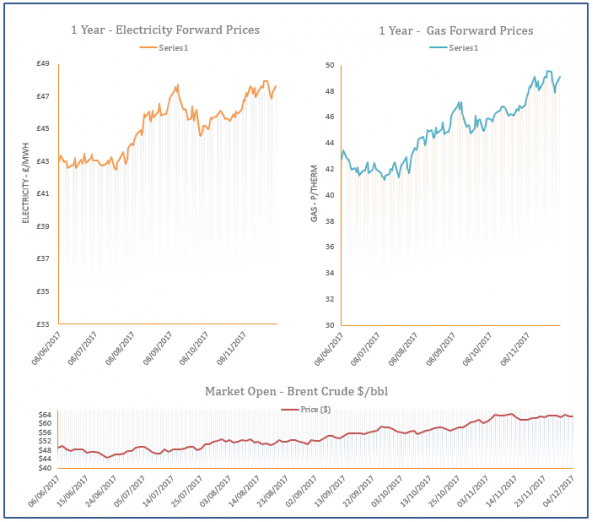
The analysis also contains a graph which tracks the one-year forward price of both gas and electricity as well as changes to Brent crude oil.
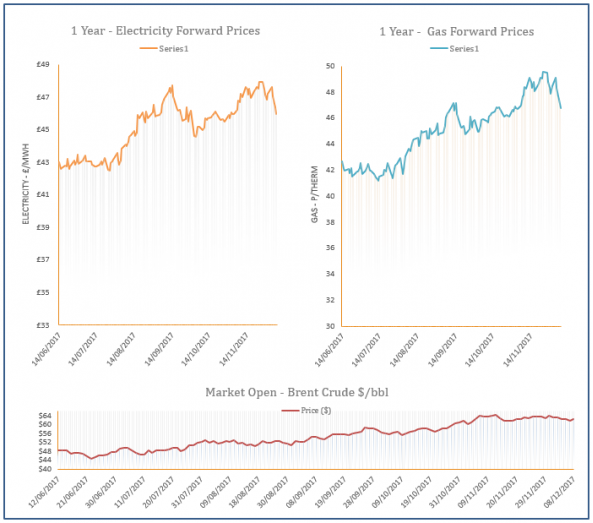
Energy Market Analysis - 08-12-2017
8th December 2017 | Posted by: Daniel Birkett | Market Analysis
Gas prices displayed mixed changes yesterday afternoon with some bullish sentiment provided by a drop in Norwegian flows and a recovery on the oil market. An outage at Kollsnes reduced flows into the UK but milder weather continued to weigh on residential demand, helping towards losses across the near-curve in the morning.
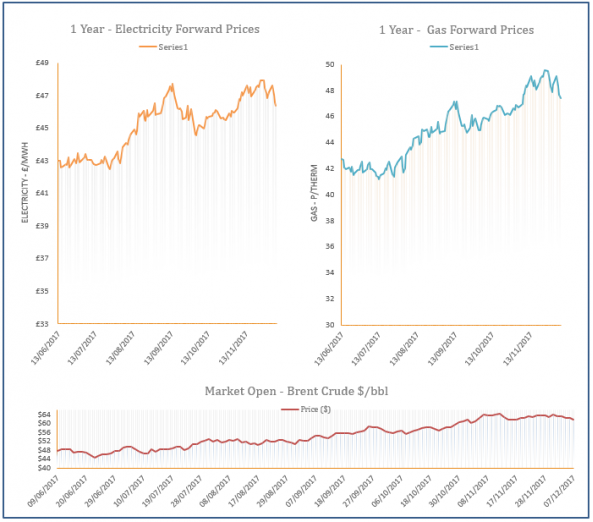
Energy Market Analysis - 07-12-2017
7th December 2017 | Posted by: Daniel Birkett | Market Analysis
Milder temperatures are expected this month and this has weighed on near-curve gas contracts during the previous two sessions as residential demand has decreased. Healthier wind levels also reduced the UK’s reliance on gas-fired generation, helping towards a long system. Further out, prices moved down following a sharp drop in oil prices in the afternoon.
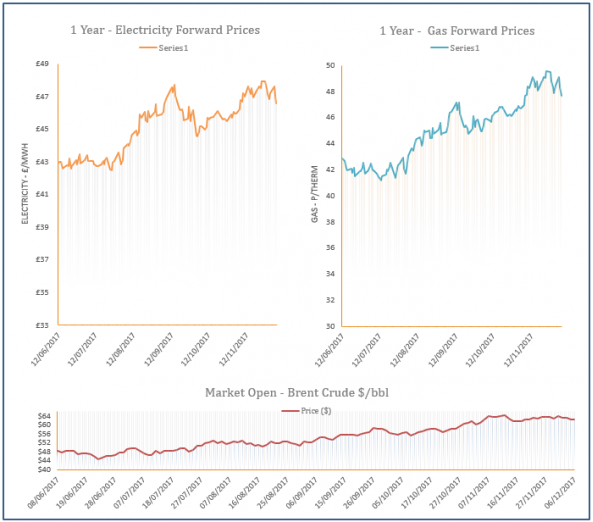
Energy Market Analysis - 06-12-2017
6th December 2017 | Posted by: Daniel Birkett | Market Analysis
Short-term weather forecasts are rather mild for this time of year and wind generation has improved, resulting in losses on the near-curve yesterday as systems across Europe were oversupplied. Further out, prices were influenced by a weaker coal market, while oil prices stabilised.
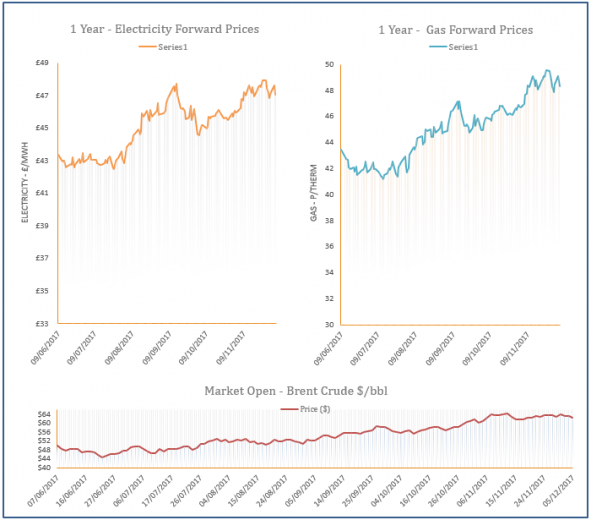
Energy Market Analysis - 05-12-2017
5th December 2017 | Posted by: Daniel Birkett | Market Analysis
A colder weather outlook exerted bullish pressure across the near gas curve yesterday as demand levels are expected to rise. LNG supply also remained low, providing additional support at the front of the curve. Further out, a sharp drop in oil prices limited gains at the back of the curve.
Energy Market Analysis - 04-12-2017
4th December 2017 | Posted by: Daniel Birkett | Market Analysis
Gas prices increased on Friday as demand levels rose to their highest point so far this winter. Further support was provided by an expected drop in temperatures later this week, while lower storage withdrawals resulted in a short system. Oil prices also displayed a small increase which supported far-curve contracts.