


Apollo Energy publishes a daily energy market analysis, focusing on the gas, power and oil markets including a commentary on how the markets close and open. Our analysis provides insight on how the markets are performing and also considers various factors which could dictate price changes in the future.
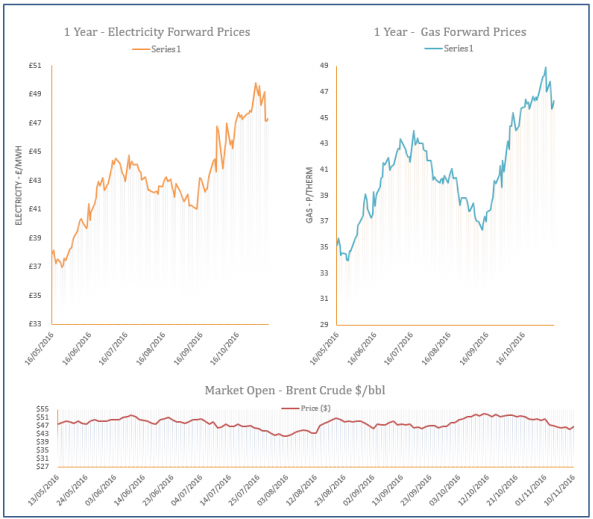
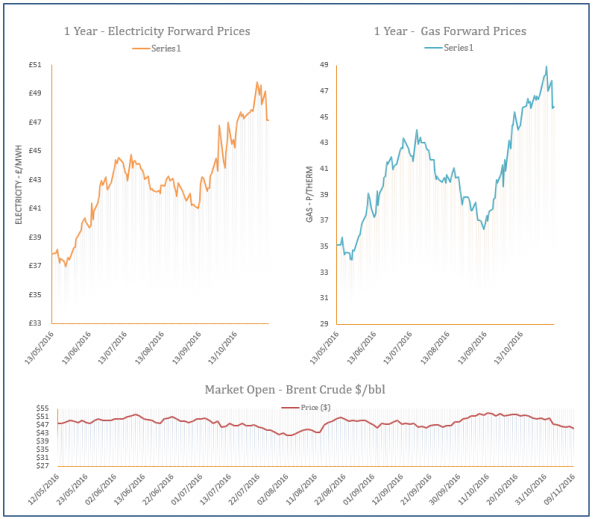
The analysis also contains a graph which tracks the one-year forward price of both gas and electricity as well as changes to Brent crude oil.

Energy Market Analysis - 15-11-2016
15th November 2016 | Posted by: Daniel Birkett | Market Analysis
Mild temperatures have been forecast for the second half of November, helping to weigh on near-curve contracts, while the back of the curve was pressured down by falling coal and oil markets. The UK gas system remained oversupplied and an expected rise in wind levels should reduce CCGT generation this week.

Energy Market Analysis - 14-11-2016
14th November 2016 | Posted by: Daniel Birkett | Market Analysis
Gas prices decreased on Friday on the back of weakening coal and oil contracts, as well as strengthening financial markets. However, a delay in restarts at French nuclear power plants restricted some of the downward movement at the front of the curve. In terms of short term supply, the UK gas system remained long throughout the session despite low LNG send-outs.

Energy Market Analysis - 11-11-2016
11th November 2016 | Posted by: Daniel Birkett | Market Analysis
Gains could be observed across the gas curve yesterday with direction coming from a stronger oil market, as the impact of the US presidential election was short-lived. Cold temperatures were also a supportive factor for near-curve contracts, despite a long gas system.
Energy Market Analysis - 10-11-2016
10th November 2016 | Posted by: Daniel Birkett | Market Analysis
Gas prices moved higher yesterday despite a bearish opening to the session, as increases on the financial markets and an unplanned outage at the Bergermeer storage site in Holland offered support. The UK gas system was oversupplied despite reduced imports from Belgium but this failed to limit the gains at the front of the curve.
Energy Market Analysis - 09-11-2016
9th November 2016 | Posted by: Daniel Birkett | Market Analysis
Gas prices moved down yesterday on the back of well-supplied gas systems across Europe and a milder weather forecast for the coming days. Imports into the UK via the BBL and IUK pipelines increased and more than offset the rise in residential demand, weighing on prices at the front of the curve. Elsewhere, the French national grid released details regarding its winter supply/ demand outlook, although no surprising information was revealed and it had little effect on the market.