


Apollo Energy publishes a daily energy market analysis, focusing on the gas, power and oil markets including a commentary on how the markets close and open. Our analysis provides insight on how the markets are performing and also considers various factors which could dictate price changes in the future.
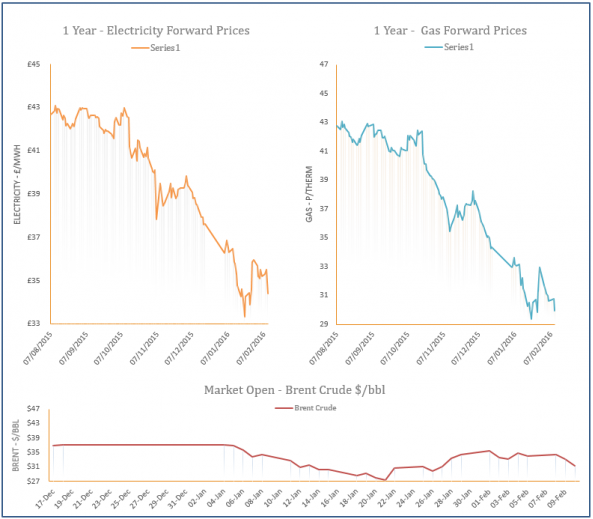
The analysis also contains a graph which tracks the one-year forward price of both gas and electricity as well as changes to Brent crude oil.
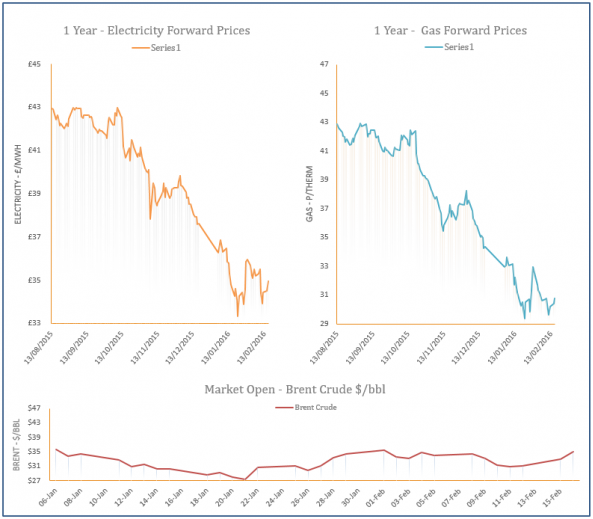
Energy Market Analysis - 16-02-2016
16th February 2016 | Posted by: Daniel Birkett | Market Analysis
The UK gas system was undersupplied on Monday which offered support to contracts across the near-curve. Planned maintenance took place at the St Fergus terminal and the Rough storage facility also went offline, temporarily. Demand levels also increased due to cold weather, while stronger oil led to gains on the far-curve.
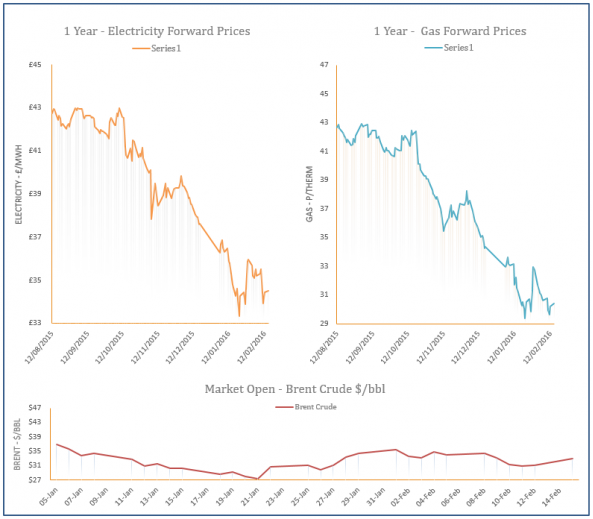
Energy Market Analysis - 15-02-2016
15th February 2016 | Posted by: Daniel Birkett | Market Analysis
Gas prices moved higher on Friday following a rebound in oil prices, with further support coming from the cold weather forecast. Below average temperatures lifted demand levels further and the UK gas system fell short as a result, with little change expected over the weekend which led to a gain for the prompt.
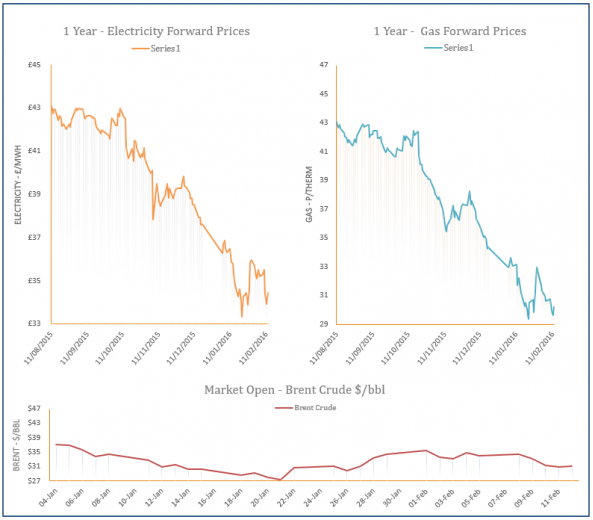
Energy Market Analysis - 12-02-2016
12th February 2016 | Posted by: Daniel Birkett | Market Analysis
Gas prices have opened at a premium this morning as strong demand and a rebound in oil dictated the market. Temperatures are expected to remain below average until the end of next week, although supply levels are generally comfortable, restricting some of the gains.
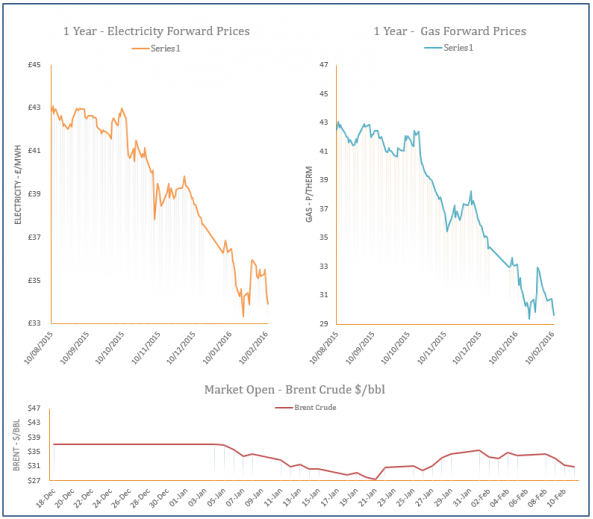
Energy Market Analysis - 11-02-2016
11th February 2016 | Posted by: Daniel Birkett | Market Analysis
Healthy supply levels weighed on near-curve gas prices yesterday despite another rise in demand levels, while contracts further along the curve tracked the movement of weakening Brent. Norwegian flows continued to improve which offset a 10mcm rise in demand and led to an oversupplied system. The Day-Ahead contract was one of the few contracts not to display a loss and was influenced by the cold weather forecast.
Energy Market Analysis - 10-02-2016
10th February 2016 | Posted by: Daniel Birkett | Market Analysis
Gas prices moved down yesterday despite higher demand levels as another drop in Brent resulted in losses across the curve. Demand levels rose from 288mcm to 306mcm but LNG send-outs remained strong and Norwegian flows improved following the end of maintenance at St Fergus. However, a weaker Pound offered some support further along the curve.