


Apollo Energy publishes a daily energy market analysis, focusing on the gas, power and oil markets including a commentary on how the markets close and open. Our analysis provides insight on how the markets are performing and also considers various factors which could dictate price changes in the future.
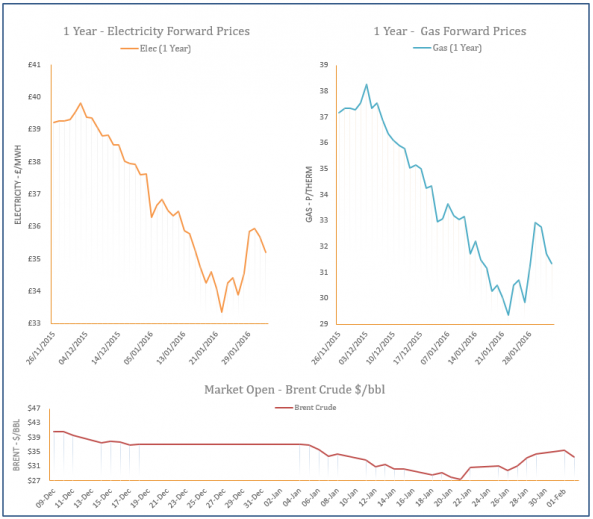
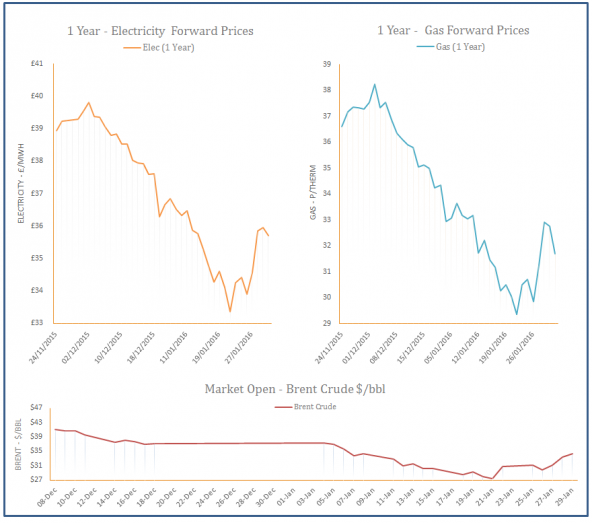
The analysis also contains a graph which tracks the one-year forward price of both gas and electricity as well as changes to Brent crude oil.
Energy Market Analysis - 02-02-2016
2nd February 2016 | Posted by: Daniel Birkett | Market Analysis
Gas prices recorded losses on Monday and were dictated by the falling oil market in the afternoon, as well as the mild weather forecast for later in the week. LNG supply is also expected to remain comfortable over the next couple of weeks and demand levels were 19mcm below the seasonal norm, resulting in an oversupplied system.
Energy Market Analysis: 01-02-2016
1st February 2016 | Market Analysis
Weak fundamentals helped gas prices close at a low on Friday after three consecutive bullish sessions. British gas demand dropped on Friday due to milder temperatures, however a drop in storage withdrawals meant that the system remained balanced.