


Apollo Energy publishes a daily energy market analysis, focusing on the gas, power and oil markets including a commentary on how the markets close and open. Our analysis provides insight on how the markets are performing and also considers various factors which could dictate price changes in the future.
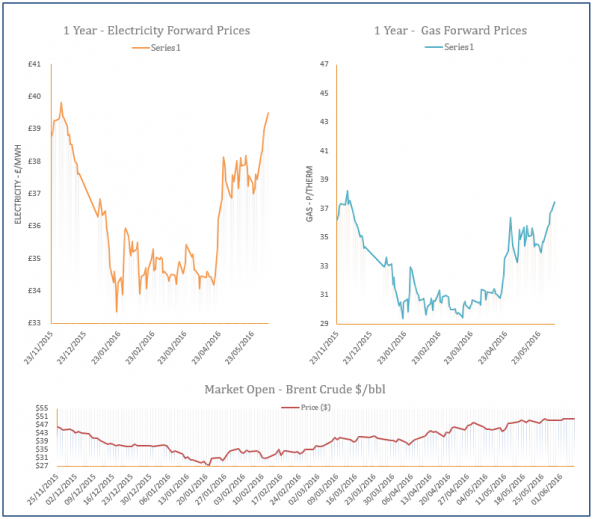
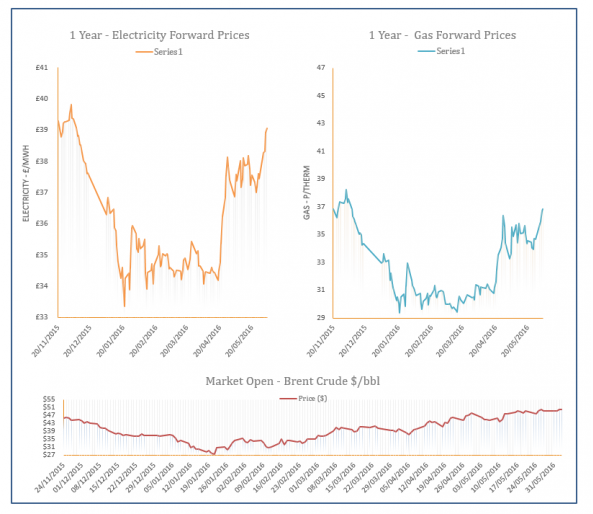
The analysis also contains a graph which tracks the one-year forward price of both gas and electricity as well as changes to Brent crude oil.
Energy Market Analysis - 06-06-2016
6th June 2016 | Posted by: Daniel Birkett | Market Analysis
Gas prices moved down on Friday on the back of a warmer weather forecast for the weekend and this week, which will weigh on demand levels. Rising Brent helped to restrict some of the downward movement further along the curve but the overall sentiment remained bearish.
Energy Market Analysis - 03-06-2016
3rd June 2016 | Posted by: Natalie Ormrod | Market Analysis
Gas balances faced further supply concerns yesterday following an outage at the North Morecambe field, in addition to the fall in Norwegian supply. LNG output also fell, contributing to increased prices, while cooler temperatures saw demand rise.

Energy Market Analysis - 02-06-2016
2nd June 2016 | Posted by: Daniel Birkett | Market Analysis
A strong fall of the Pound against the Euro saw NBP ICE July 2016 prices increase by 0.24p/th. Far curve prices were slightly down but will likely respond to the OPEC meeting being held today.

Energy Market Analysis - 01-06-2016
1st June 2016 | Posted by: Natalie Ormrod | Market Analysis
Gas prices continued to increase yesterday, supported by the drop in Norwegian supply after the Kollsnes plant and Troll field were brought offline for annual maintenance. Additional bullish pressure came from the expected return of the Rough storage facility.