


Apollo Energy publishes a daily energy market analysis, focusing on the gas, power and oil markets including a commentary on how the markets close and open. Our analysis provides insight on how the markets are performing and also considers various factors which could dictate price changes in the future.
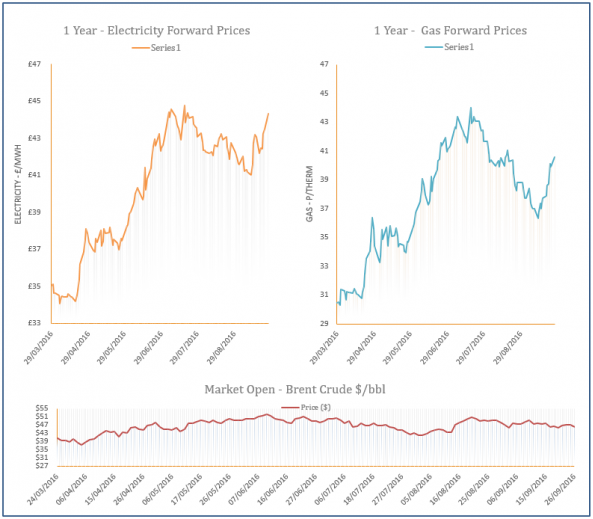
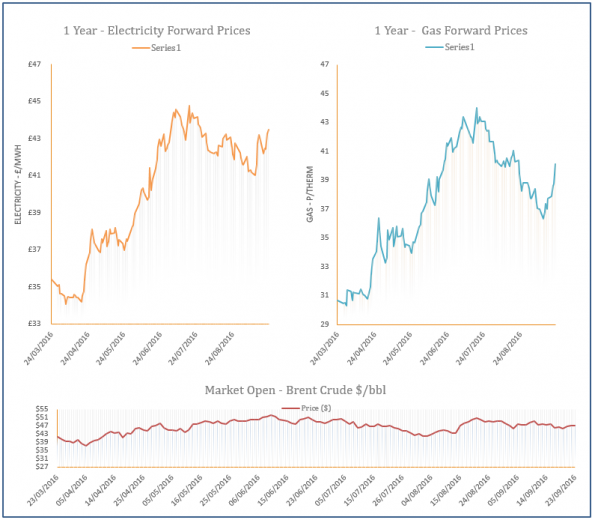
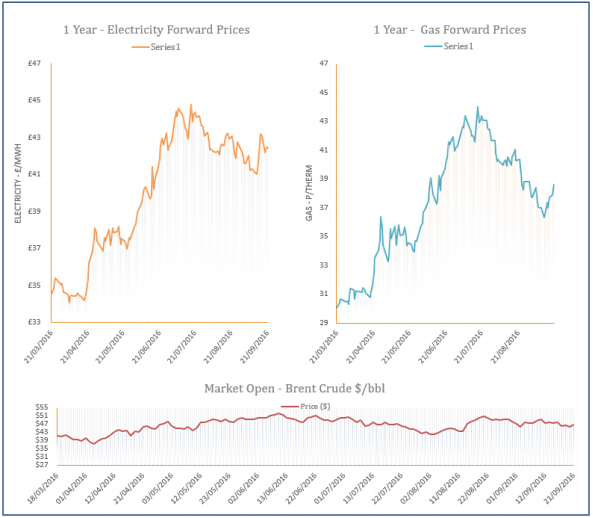
The analysis also contains a graph which tracks the one-year forward price of both gas and electricity as well as changes to Brent crude oil.
Energy Market Analysis - 26-09-2016
26th September 2016 | Posted by: Daniel Birkett | Market Analysis
Gas prices moved higher on Friday on the back of outages in Norway, with planned maintenance at the Kollsnes facility scheduled for today, until the 30th of September; reducing flows by 46mcm. A long UK gas system failed to have much influence on prices as a weaker Pound provided additional support.
Energy Market Analysis - 23-09-2016
23rd September 2016 | Posted by: Daniel Birkett | Market Analysis
The UK gas system fell short on Thursday following a significant drop in Norwegian flows due to an outage at the Vesterled pipeline, this resulted in bullish movement across the near gas curve. Further out, the rising oil market continued to act as the main market driver and most contracts moved higher.
Market Update - Potential Penalty Charges during the Winter Period
23rd September 2016 | Posted by: Daniel Birkett | Industry News
Businesses which exceed their daily capacity could incur commercial penalty charges during the winter period.

Energy Market Analysis - 22-09-2016
22nd September 2016 | Posted by: Daniel Birkett | Market Analysis
UK supply levels fell by 10mcm yesterday, while demand also increased, tightening the system and resulting in bullish movement on the curve. Exports to Belgium were also high and an outage at a Norwegian facility was extended by a day. Meanwhile, a bullish oil market provided upward pressure on the far-curve.
Energy Market Analysis - 21-09-2016
21st September 2016 | Posted by: Daniel Birkett | Market Analysis
LNG send-outs were strong on Tuesday due to an expected delivery from Qatar, while the restart of flows via the BBL pipeline resulted in comfortable systems in the UK and in other European nations. This improved supply picture led to losses across the near-curve, although a rise in Brent helped to limit the downward movement further out.