


Apollo Energy publishes a daily energy market analysis, focusing on the gas, power and oil markets including a commentary on how the markets close and open. Our analysis provides insight on how the markets are performing and also considers various factors which could dictate price changes in the future.
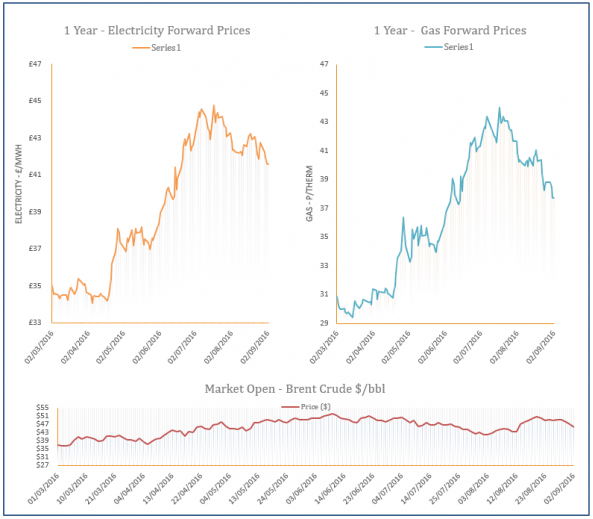
The analysis also contains a graph which tracks the one-year forward price of both gas and electricity as well as changes to Brent crude oil.
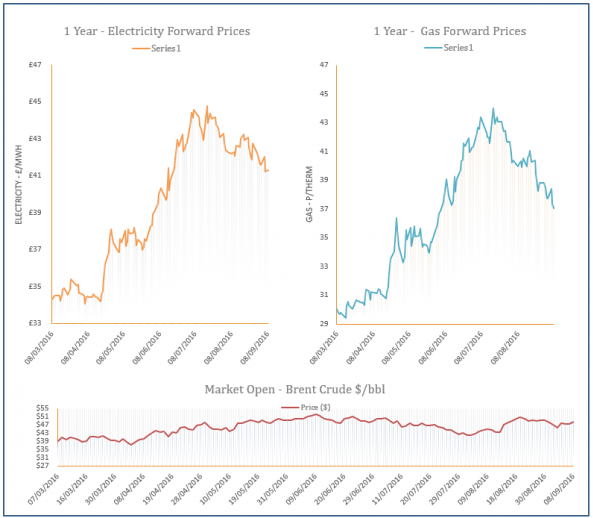
Energy Market Analysis - 08-09-2016
8th September 2016 | Posted by: Daniel Birkett | Market Analysis
The UK gas system was oversupplied on Wednesday following a rise in UKCS flows via Bacton Seal, while a jump in wind levels led to a decrease in gas-fired power generation. Meanwhile, LNG send-outs were above 50mcm with numerous deliveries expected to arrive from Qatar over the next fortnight. This healthier supply picture helped near-curve gas contracts to fall but rising Brent provided support further out.
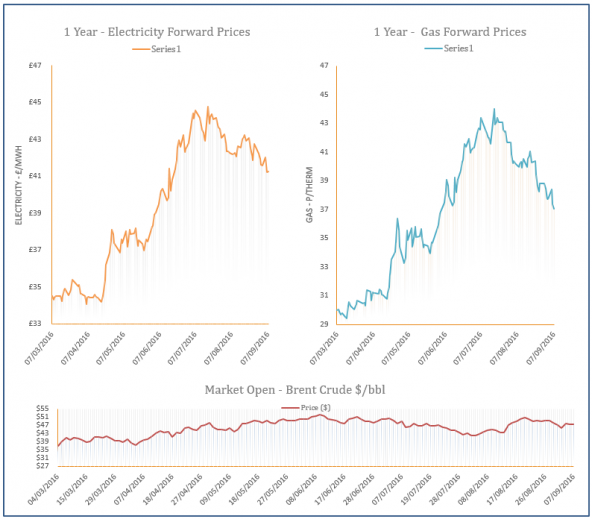
Energy Market Analysis - 07-09-2016
7th September 2016 | Posted by: Daniel Birkett | Market Analysis
Gas contracts displayed mixed movement on Tuesday with the prompt adding to its price later in the session, while the far-curve displayed numerous losses. The UK gas system was short throughout the day which helped near-curve contracts move higher, while stable Brent helped contracts further out decrease.
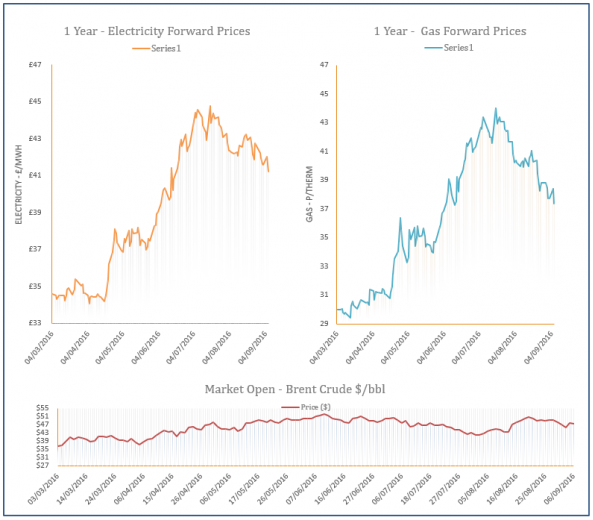
Energy Market Analysis - 06-09-2016
6th September 2016 | Posted by: Daniel Birkett | Market Analysis
Unplanned outages resulted in reduced UKCS production on Monday, while demand levels in the UK also rose to 22% above the seasonal norm, resulting in a significantly undersupplied system. This led to a strong rise on the prompt with gains displayed across the curve, although some of the upward movement was restricted by the scheduled arrival of several LNG deliveries from Qatar.
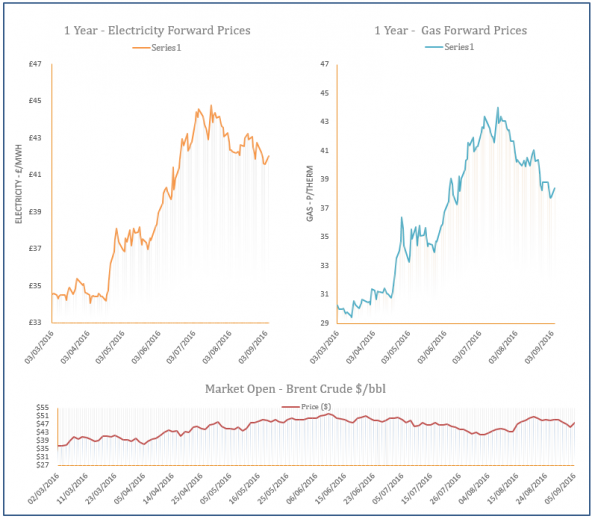
Energy Market Analysis - 05-09-2016
5th September 2016 | Posted by: Daniel Birkett | Market Analysis
Day-Ahead gas climbed higher on Friday after dropping to its lowest prices for seven years on Thursday, with the gains filtering through to the rest of the near-curve. A drop in Norwegian imports via the Langeled pipeline in the afternoon resulted in an undersupplied gas system, with weaker LNG send-outs also a factor.
Energy Market Analysis - 02-09-2016
2nd September 2016 | Posted by: Daniel Birkett | Market Analysis
Gas prices displayed further losses on Thursday as the UK gas system was long throughout the session, with a rise in Norwegian imports also expected today. Norwegian flows are set to be redirected to the UK due to maintenance at pipelines to mainland Europe. LNG send-outs also increased with several deliveries expected to arrive in the coming weeks; this resulted in losses across the near-curve, while contracts further out were pressured down by falling Brent.