Apollo Energy publishes a daily energy market analysis, focusing on the gas, power and oil markets including a commentary on how the markets close and open. Our analysis provides insight on how the markets are performing and also considers various factors which could dictate price changes in the future.
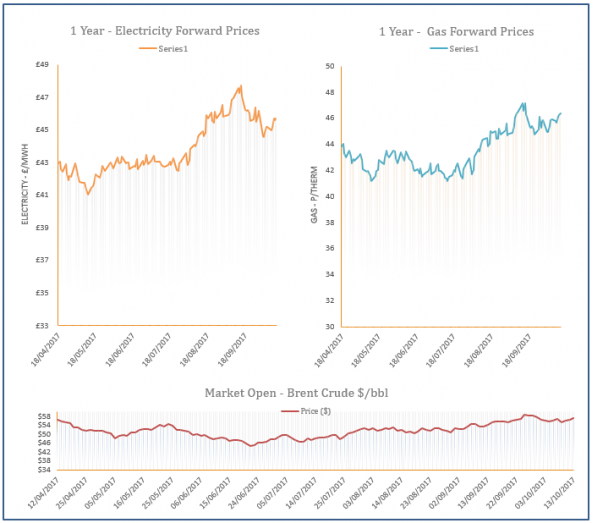
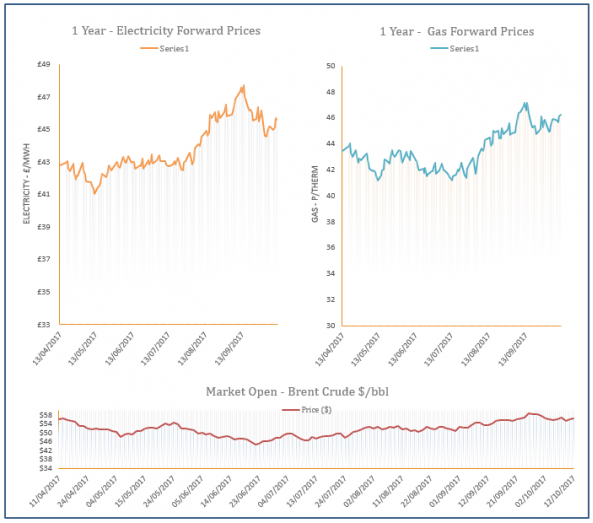
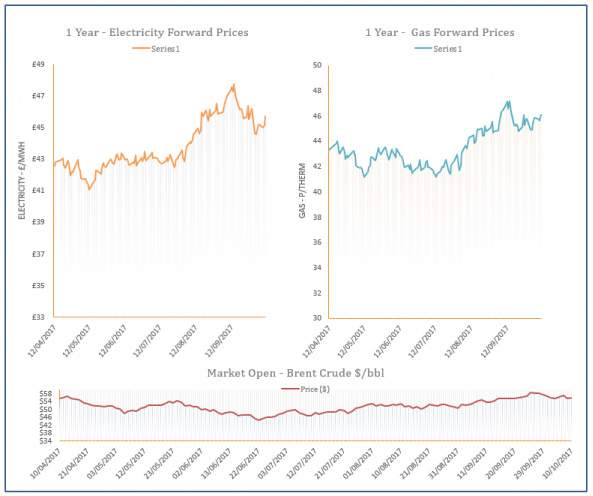
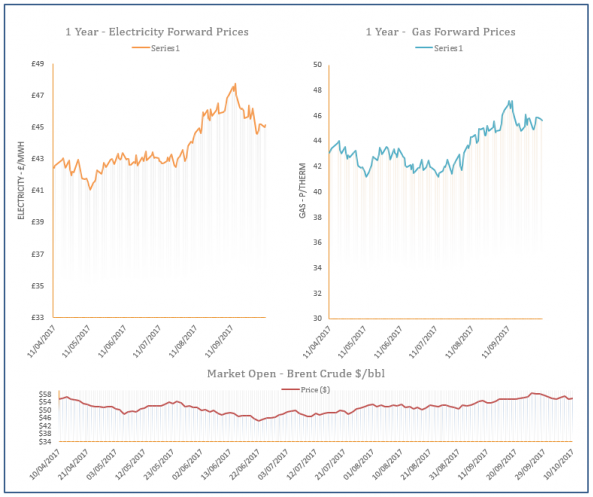
The analysis also contains a graph which tracks the one-year forward price of both gas and electricity as well as changes to Brent crude oil.
Plans revealed for domestic energy price cap
13th October 2017 | Posted by: Daniel Birkett | Industry News
The draft legislation to cap domestic energy bills has been published by the government, the BBC reports.
Energy Market Analysis - 13-10-2017
13th October 2017 | Posted by: Daniel Birkett | Market Analysis
An improved outlook for demand and supply levels helped to pressure down prompt gas prices on Thursday. Norwegian imports ramped up following the return of Kollsnes and warmer weather reduced residential demand, resulting in an oversupplied system. However, contracts further out were bullish with support provided by a weak Pound and rising coal & oil markets.
Energy Market Analysis - 12-10-2017
12th October 2017 | Posted by: Daniel Birkett | Market Analysis
Near-curve gas prices moved down yesterday as the Kollsnes processing plant in Norway returned online following a planned outage. The Corrib gas field in Ireland also returned following numerous delays which reduced UK exports, further weighing on the prompt. Movement at the back of the curve was more subdued as stronger coal offered resistance to the bears.
Energy Market Analysis - 11-10-2017
11th October 2017 | Posted by: Stephen Berrey | Market Analysis
A rise in temperature forecasts for the remainder of October effected European gas prices on Tuesday. Short - term maturities posted the biggest losses and shrugged off an ongoing cut in Norwegian gas supply due to planned maintenance work. The UK system was heavily oversupplied throughout the session, leading to a plunge in NBP day-ahead prices.
Energy Market Analysis - 10-10-2017
10th October 2017 | Posted by: Daniel Birkett | Market Analysis
Gas prices on the near-curve moved higher ahead of scheduled maintenance work in Europe which will reduce flows into the UK. French nuclear supply also remains a factor as safety checks will limit available capacity, resulting in increased gas-fired generation. A rise in LNG prices also contributed to the gains, while there was little change on oil and coal markets.


