


Apollo Energy publishes a daily energy market analysis, focusing on the gas, power and oil markets including a commentary on how the markets close and open. Our analysis provides insight on how the markets are performing and also considers various factors which could dictate price changes in the future.
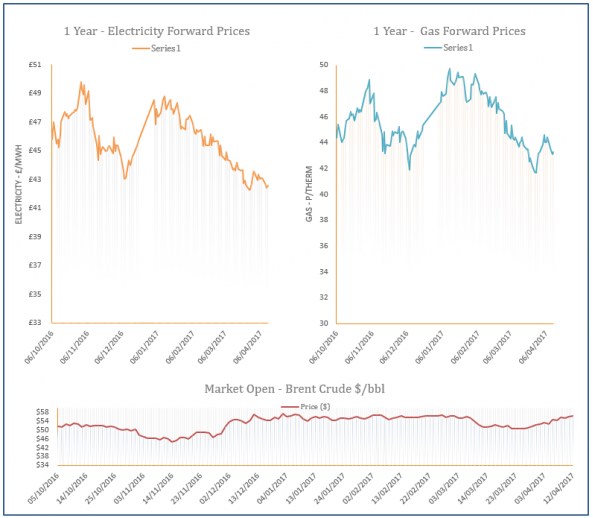
The analysis also contains a graph which tracks the one-year forward price of both gas and electricity as well as changes to Brent crude oil.
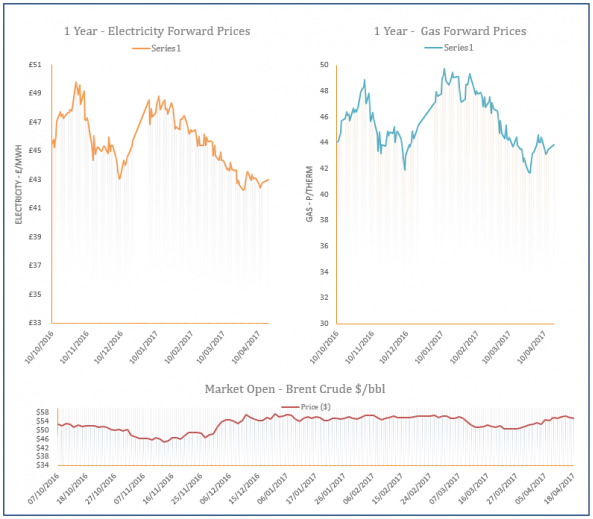
Energy Market Analysis - 18-04-2017
18th April 2017 | Posted by: Daniel Birkett | Market Analysis
An announcement by Centrica confirmed that the Rough storage facility would be unavailable until May 2018 at the earliest, applying bullish pressure to the gas curve at the end of last week. Supply levels were generally healthy but a cooler weather forecast for the weekend and the start of this week restricted any downward movement.

Energy Market Analysis - 13-04-2017
13th April 2017 | Posted by: Daniel Birkett | Market Analysis
Gas prices displayed mixed movement yesterday following an announcement by Centrica confirming that the Rough storage facility would be unavailable until May 2018 at the earliest, read more here. Comfortable supply levels provided some bearish pressure at the front of the curve, while stronger oil supported contracts on the far-curve.

Rough will not restart injections in 2017/18 storage year
12th April 2017 | Posted by: Daniel Birkett | Industry News
The Rough storage facility will not restart injection operations in the 2017/18 storage due to safety concerns.
Energy Market Analysis - 12-04-2017
12th April 2017 | Posted by: Daniel Birkett | Market Analysis
Near-curve gas contracts posted losses yesterday following a strong rise in Norwegian flows and a drop in storage withdrawals. The supply outlook is healthy despite cooler temperatures, with higher wind power resulting in a drop in gas-fired generation. Further out, the downward movement was restricted by a bullish oil market.

Energy Market Analysis - 11-04-2017
11th April 2017 | Posted by: Daniel Birkett | Market Analysis
Gas prices decreased throughout Monday’s session as a result of stronger imports from Norway and healthy UKCS production, with a rise in demand levels having little impact. An increase in Russian imports resulted in comfortable systems across Europe, adding to the bearish sentiment, although oil prices remained supportive.