


Apollo Energy publishes a daily energy market analysis, focusing on the gas, power and oil markets including a commentary on how the markets close and open. Our analysis provides insight on how the markets are performing and also considers various factors which could dictate price changes in the future.
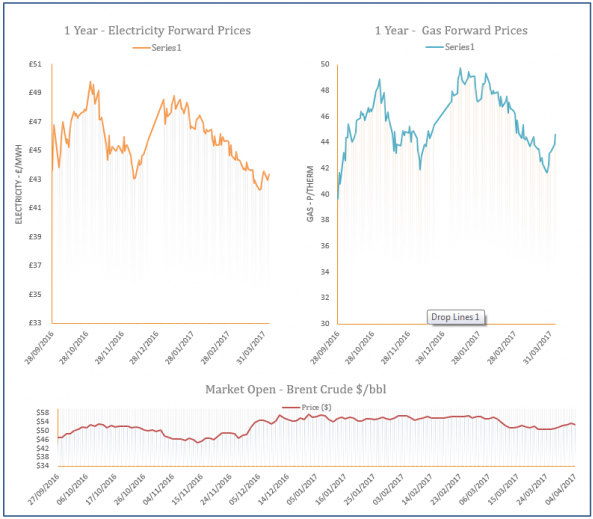
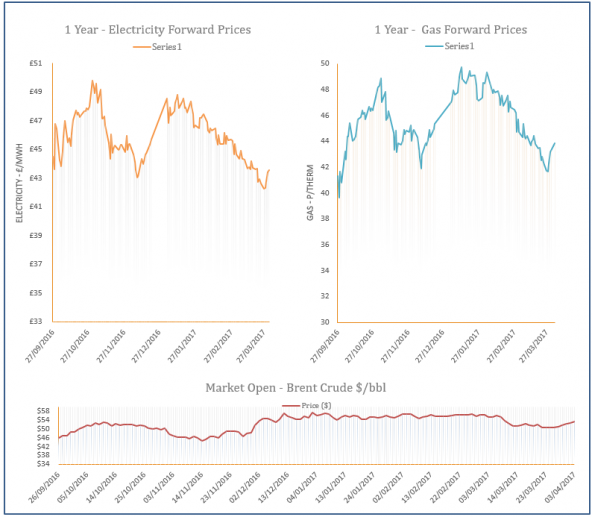
The analysis also contains a graph which tracks the one-year forward price of both gas and electricity as well as changes to Brent crude oil.
Energy Market Analysis - 04-04-2017
4th April 2017 | Posted by: Daniel Birkett | Market Analysis
Demand levels are expected to be slightly higher this week which helped to push near-curve gas contracts higher on Monday. Meanwhile, coal prices strengthened due to a drop in Australian production as a result of Cyclone Debbie, offering support further along the curve. In terms of supply, the UK gas system was balanced with exports to Belgium reaching their highest level since September 2016.
Energy Market Analysis - 03-04-2017
3rd April 2017 | Posted by: Daniel Birkett | Market Analysis
Gas prices moved down on Friday following bullish movement in the previous three sessions, ahead of the expiry of some near-curve contracts. Prices took direction from warmer temperatures which weighed on demand levels over the weekend and today, while the supply outlook was also improved.