


Apollo Energy publishes a daily energy market analysis, focusing on the gas, power and oil markets including a commentary on how the markets close and open. Our analysis provides insight on how the markets are performing and also considers various factors which could dictate price changes in the future.
The analysis also contains a graph which tracks the one-year forward price of both gas and electricity as well as changes to Brent crude oil.
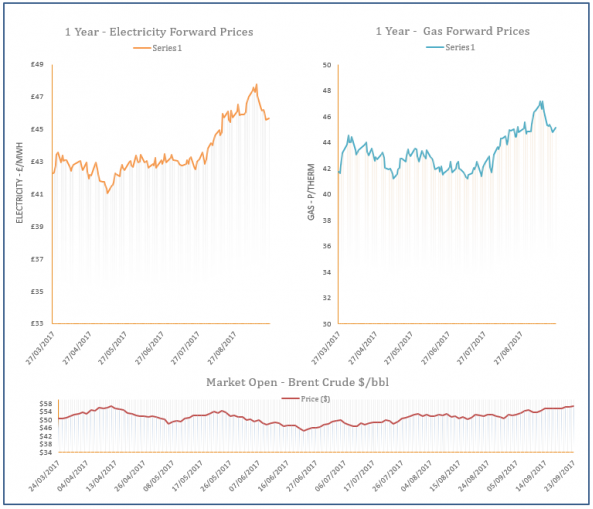
Energy Market Analysis - 25-09-2017
25th September 2017 | Posted by: Daniel Birkett | Market Analysis
Gas prices moved down on Friday with the help of a more positive supply outlook across Europe. The re-opening of the Nordstream pipeline resulted in a sharp rise in Russian flows, while Norwegian imports into the UK have also ramped up, in addition to improved UKCS production.
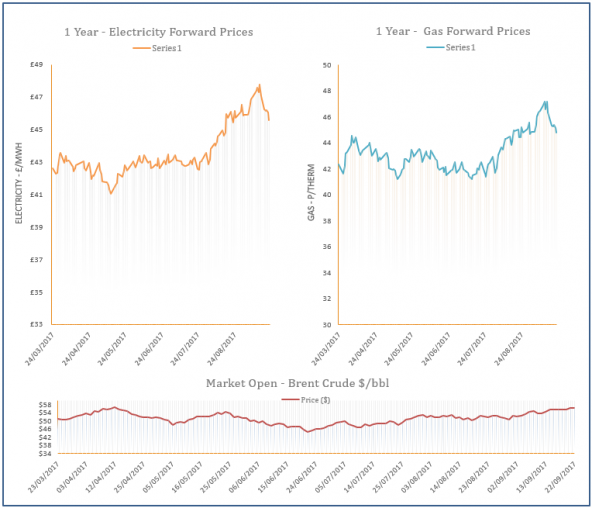
Energy Market Analysis - 22-09-2017
22nd September 2017 | Posted by: Daniel Birkett | Market Analysis
Gas prices weakened on Thursday thanks to a positive supply/ demand outlook and a falling coal market. Mild weather is expected to weigh on residential demand, while the return of the Nordstream pipeline has improved supply levels on the continent. An extension to the Kollsnes outage restricted losses on the prompt, with another planned outage also scheduled at Karsto next week.

UK oil and gas reserves could run out in ten years
21st September 2017 | Posted by: Daniel Birkett | Industry News
According to new research, the UK’s oil and gas reserves could expire in 10-years’ time, which would result in a 100% reliance on foreign imports.
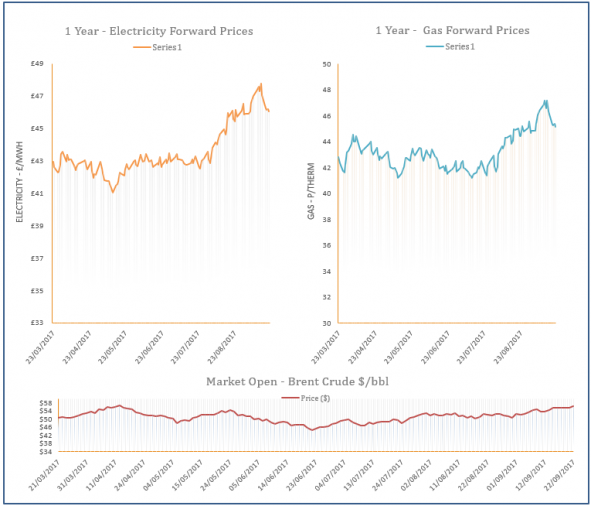
Energy Market Analysis - 21-09-2017
21st September 2017 | Posted by: Daniel Birkett | Market Analysis
An improved supply outlook and a milder weather forecast weighed on near-curve gas contracts yesterday. The Langeled pipeline returned following a 1-day shutdown and above-average temperatures should reduce demand levels, weighing on prices, with a comfortable European LNG outlook also a factor. Further out, a sharp drop in coal prices offset the impact of bullish oil.
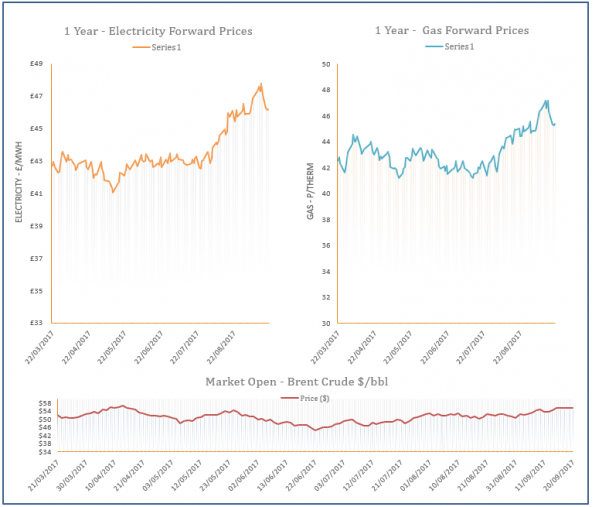
Energy Market Analysis - 20-09-2017
20th September 2017 | Posted by: Daniel Birkett | Market Analysis
Movement along the gas curve varied yesterday with a lower demand outlook for the rest of the week applying bearish pressure on the prompt. Norwegian imports were reduced due to a shutdown of the Langeled pipeline but the facility has returned online today. However, an outage at Kollsnes has been extended till Friday, offering support to the rest of the near-curve.