


Apollo Energy publishes a daily energy market analysis, focusing on the gas, power and oil markets including a commentary on how the markets close and open. Our analysis provides insight on how the markets are performing and also considers various factors which could dictate price changes in the future.
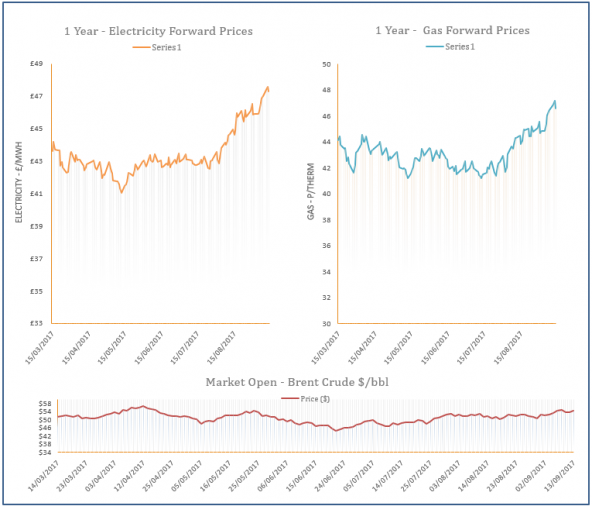
The analysis also contains a graph which tracks the one-year forward price of both gas and electricity as well as changes to Brent crude oil.
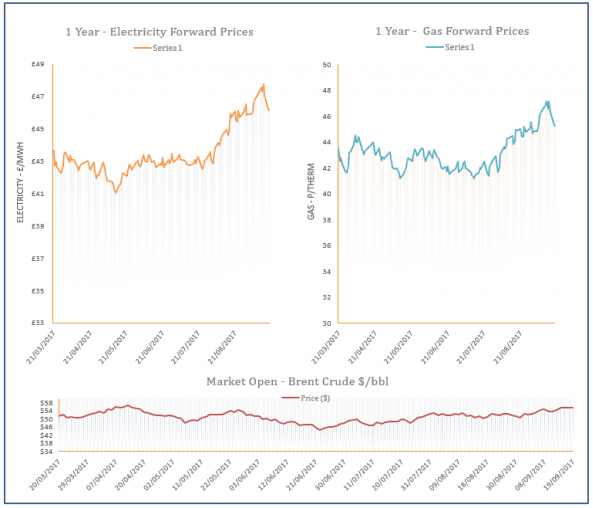
Energy Market Analysis - 19-09-2017
19th September 2017 | Posted by: Daniel Birkett | Market Analysis
Gas prices displayed mixed movement yesterday as cold weather lifted demand and Norwegian supply was limited, resulting in a short system. Reduced wind generation contributed to an increase in CCGT demand which added to the undersupply. However, the outlook for later in the week is healthy and this helped to restrict the gains, while weaker coal and oil weighed on the far-curve.
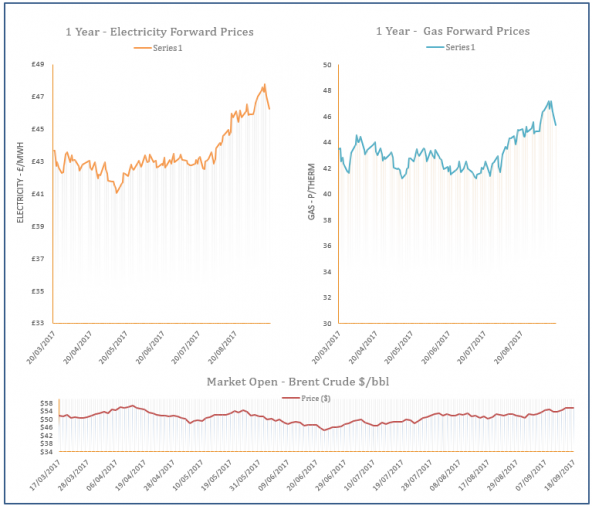
Energy Market Analysis - 18-09-2017
18th September 2017 | Posted by: Daniel Birkett | Market Analysis
Gas prices moved down at the end of last week following bearish movement on power, coal and carbon markets. The Pound also strengthened against the Euro, further weighing on the curve. Prices on the near-curve were more resilient as colder weather today and tomorrow will lift demand, while supply is slightly restricted.
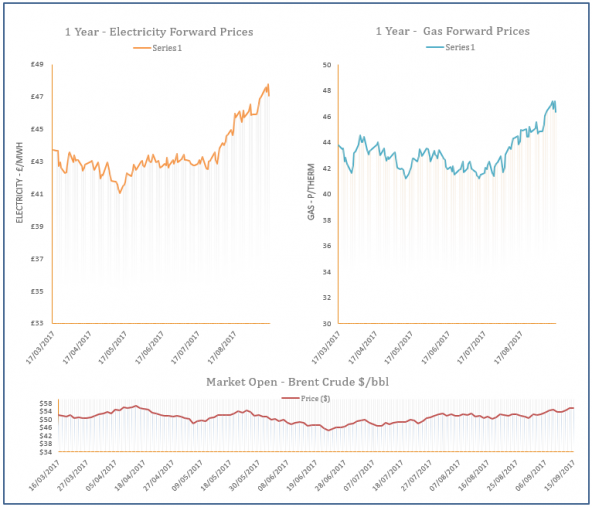
Energy Market Analysis - 15-09-2017
15th September 2017 | Posted by: Daniel Birkett | Market Analysis
Strong residential demand and a rise in CCGT generation supported gas contracts on Thursday despite improved supply levels which resulted in a long system. Bullish pressure was provided by higher power and carbon contracts, while oil and coal were generally stable.
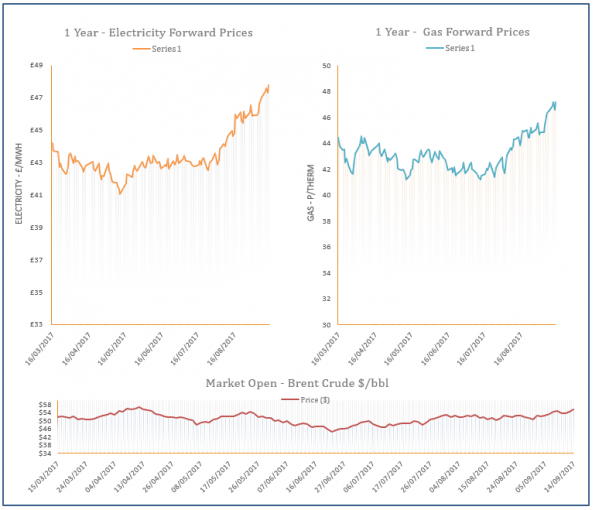
Energy Market Analysis - 14-09-2017
14th September 2017 | Posted by: Daniel Birkett | Market Analysis
A rise in oil prices helped to push gas contracts higher yesterday afternoon with further bullish pressure provided by stronger coal and carbon. LDZ demand is forecast to fall next week as milder temperatures return to the UK and an LNG delivery is expected to dock at South Hook on Monday, limiting gains on the near-curve.
Energy Market Analysis - 13-09-2017
13th September 2017 | Posted by: Daniel Birkett | Market Analysis
Improved Norwegian supply helped gas contracts move down yesterday afternoon, erasing some of the morning’s gains. Strong wind generation reduced CCGT demand but colder temperatures lifted residential consumption. Further out, bearish movement was limited by a jump in oil prices and stronger coal.