


Apollo Energy publishes a daily energy market analysis, focusing on the gas, power and oil markets including a commentary on how the markets close and open. Our analysis provides insight on how the markets are performing and also considers various factors which could dictate price changes in the future.
The analysis also contains a graph which tracks the one-year forward price of both gas and electricity as well as changes to Brent crude oil.
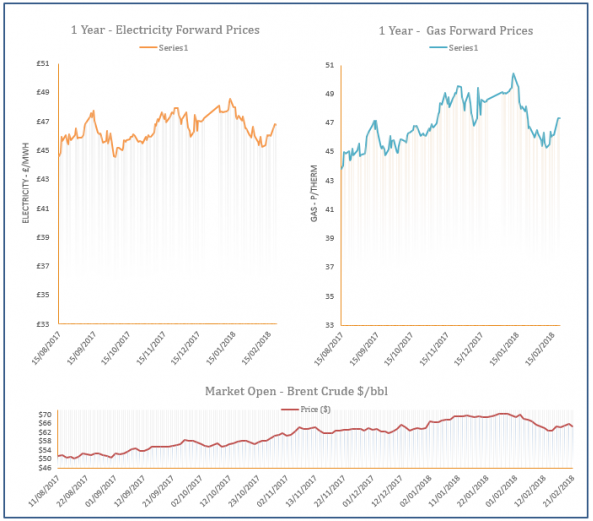
Energy Market Analysis - 21-02-2018
21st February 2018 | Posted by: Daniel Birkett | Market Analysis
The expected rise in demand in the coming weeks continued to provide upward pressure at the front of the gas curve yesterday, with an extended outage in Holland also assisting the bulls. Norwegian flows were also down due to an unplanned outage. Meanwhile, far curve contracts displayed minimal changes as coal and oil markets stabilised.

Top ranking once again for services
20th February 2018 | Posted by: Apollo Energy | Company News
Apollo Energy has once again been ranked top for its client services in an index by a leading industry commentator. It was jointly awarded the number one spot for its service provision to industrial and commercial clients in Cornwall Energy's newly published Q3 2017 review.
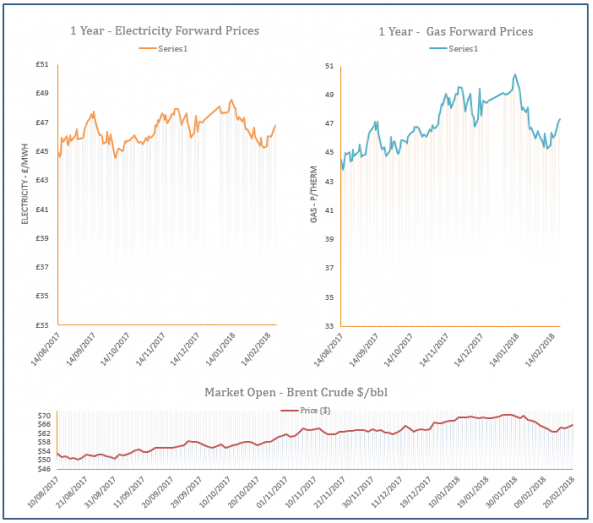
Energy Market Analysis - 20-02-2018
20th February 2018 | Posted by: Daniel Birkett | Market Analysis
Yesterday’s weather forecasts pointed towards cold temperatures for a 2-week period, starting from the end of this week; this will increase residential demand and resulted in gains at the front of the gas curve. LNG send-outs to Europe are also lower, providing additional support, while the far-curve was pushed higher by rising coal and oil.
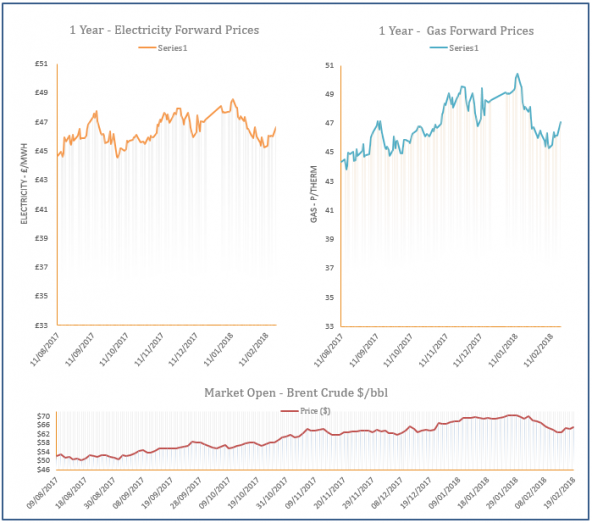
Energy Market Analysis - 19-02-2018
19th February 2018 | Posted by: Daniel Birkett | Market Analysis
Temperatures were forecast to turn colder later this week, continuing till the end of the month, resulting in upward movement on the near gas curve on Friday. Further out, contracts were pushed higher by increases on coal and oil markets, with APi2 coal climbing above $81/tn.
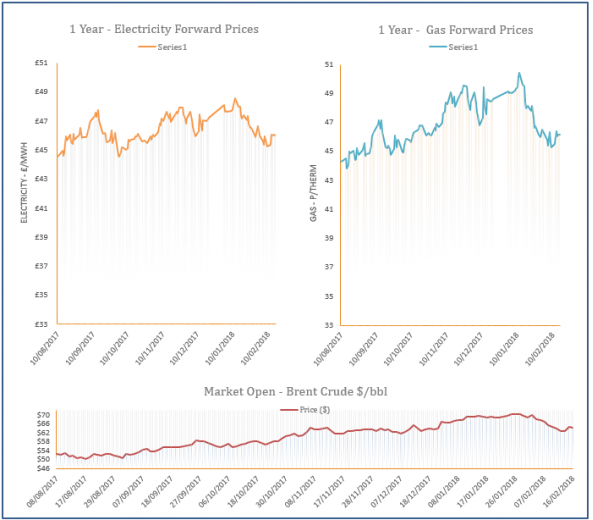
Energy Market Analysis - 16-02-2018
16th February 2018 | Posted by: Daniel Birkett | Market Analysis
Weather forecasts for next week were uncertain yesterday and this resulted in some bearish movement at front of the gas curve. The prompt moved down on the back of a mild weather outlook for today, although CCGT demand was set to rise, ensuring any losses were minor. Further out, a downward correction in coal and oil prices helped most contracts record a loss.