


Apollo Energy publishes a daily energy market analysis, focusing on the gas, power and oil markets including a commentary on how the markets close and open. Our analysis provides insight on how the markets are performing and also considers various factors which could dictate price changes in the future.
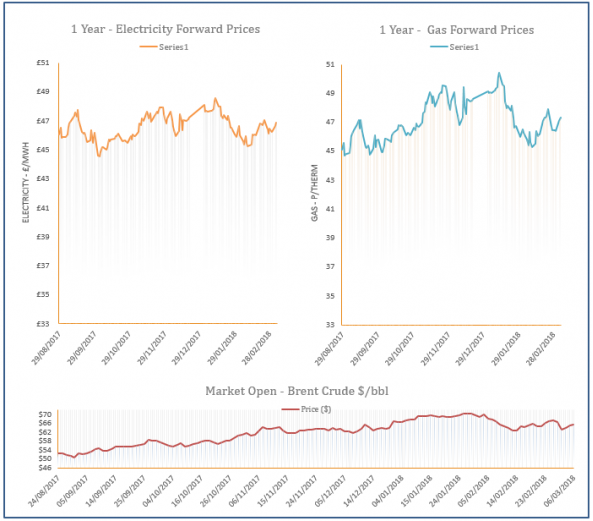
The analysis also contains a graph which tracks the one-year forward price of both gas and electricity as well as changes to Brent crude oil.

Energy Market Analysis - 08-03-2018
8th March 2018 | Posted by: Daniel Birkett | Market Analysis
A healthy supply outlook for today helped to weigh on the prompt during Wednesday’s session, although the rest of the near-curve found support from an expected drop in temperatures towards the end of the month and the start of April. Further out, prices initially opened higher but moved down later in the session following a sharp drop in oil prices.

Energy Market Analysis - 07-03-2018
7th March 2018 | Posted by: Daniel Birkett | Market Analysis
Gas prices displayed mixed movement yesterday with upward movement on the prompt limited by weaker demand and a comfortable system. However, below average temperatures are forecast for April, pushing the front-month higher, while the far-curve was supported by bullish coal and oil markets.
Energy Market Analysis - 06-03-2018
6th March 2018 | Posted by: Daniel Birkett | Market Analysis
Above average temperatures are expected later in the week which will weigh on demand levels, contributing to losses on the near-curve yesterday. The system was also long as demand decreased and pipeline supply improved. Movement further along the curve was generally stable, with support provided by rising coal and oil markets.
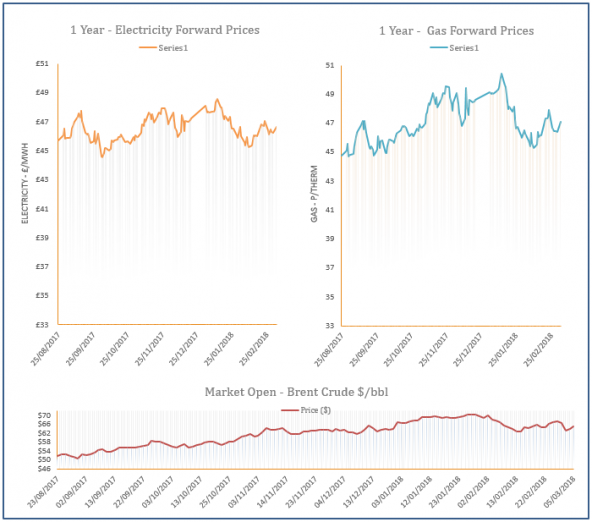
Energy Market Analysis - 05-03-2018
5th March 2018 | Posted by: Daniel Birkett | Market Analysis
Gas prices decreased on Friday ahead of a milder weather outlook for this week. Most contracts erased some of the gains caused by unseasonably high demand and supply tightness, with the National Grid withdrawing its gas deficit warning. Contracts further along the curve, stabilised in the afternoon as a rebound in coal offset the effects of weaker Brent.
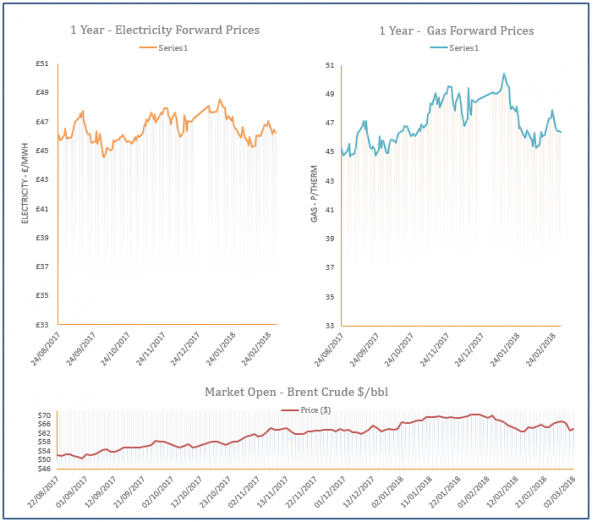
Energy Market Analysis - 02-03-2018
2nd March 2018 | Posted by: Daniel Birkett | Market Analysis
Prompt gas prices moved higher on Thursday, with Day-Ahead in particular recording a huge increase on the back of a warning issued by the national grid which requested additional flows from Europe in order to meet demand. Freezing temperatures offered support to the rest of the near-curve but contracts further out moved down, taking direction from weaker coal and oil markets.