


Apollo Energy publishes a daily energy market analysis, focusing on the gas, power and oil markets including a commentary on how the markets close and open. Our analysis provides insight on how the markets are performing and also considers various factors which could dictate price changes in the future.
The analysis also contains a graph which tracks the one-year forward price of both gas and electricity as well as changes to Brent crude oil.
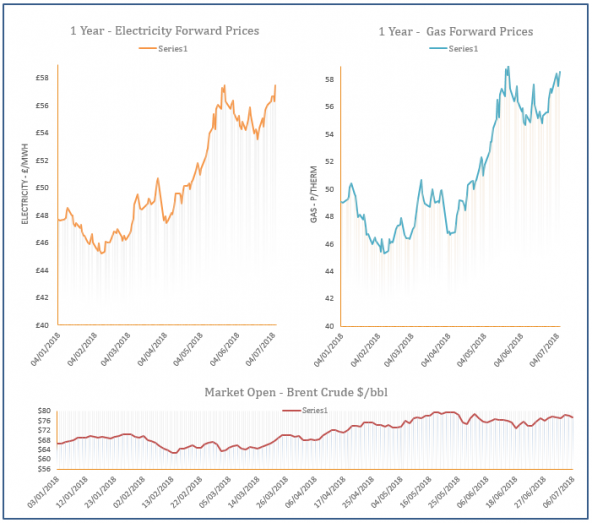
Energy Market Analysis - 06-07-2018
6th July 2018 | Posted by: Daniel Birkett | Market Analysis
Gas prices initially opened lower but rallied higher as the session progressed to close at a premium. Carbon and coal prices supported contracts at the back of the curve, while the near-curve was dictated by high storage injections, a weak LNG outlook and a lack of wind generation which increased CCGT demand.

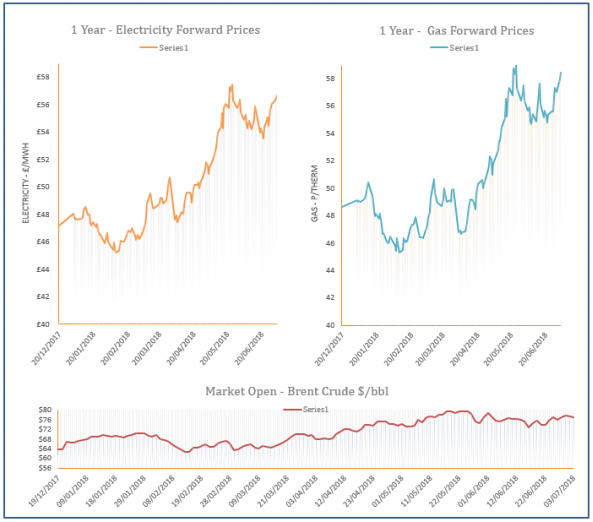
Energy Market Analysis - 05-07-2018
5th July 2018 | Posted by: Daniel Birkett | Market Analysis
Gas prices on the near-curve recorded small gains during yesterday’s session, with weak LNG supply and a rise in storage injections offering support. However, resistance was provided by improved Norwegian flows which resulted in an oversupplied system. Sentiment further along the curve was slightly bearish despite rising coal prices as the oil market stabilised.

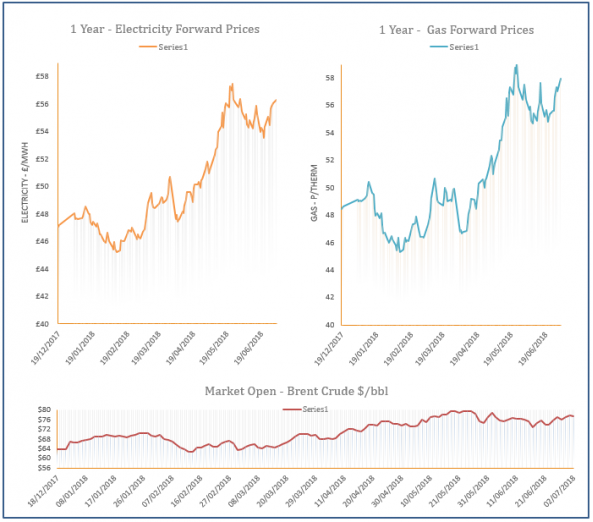
Energy Market Analysis - 04-07-2018
4th July 2018 | Posted by: Daniel Birkett | Market Analysis
Gas prices moved higher during Tuesday’s session as demand for storage injections increased and low wind levels resulted in higher gas-fired power generation. LNG supply was also low due to higher Asian prices, while rising fuel markets supported prices at the back of the curve.
Energy Market Analysis - 03-07-2018
3rd July 2018 | Posted by: Daniel Birkett | Market Analysis
Gas prices increased strongly on Monday with the coal market providing on-going support across European energy markets. Oil prices inched down following significant upward movement on Friday, while a comfortable system helped to limit gains at the front of the curve.
Energy Market Analysis - 02-07-2018
2nd July 2018 | Posted by: Daniel Birkett | Market Analysis
Movement along the gas curve varied on Friday with an increase in Norwegian and UKCS flows weighing on near-curve prices, while stronger fuel prices supported the far-curve. Several outages were resolved which resulted in improved supply coming into the UK, while oil rose to almost $80/b and coal was supported by higher Asian demand and some supply issues.