


Apollo Energy publishes a daily energy market analysis, focusing on the gas, power and oil markets including a commentary on how the markets close and open. Our analysis provides insight on how the markets are performing and also considers various factors which could dictate price changes in the future.
The analysis also contains a graph which tracks the one-year forward price of both gas and electricity as well as changes to Brent crude oil.
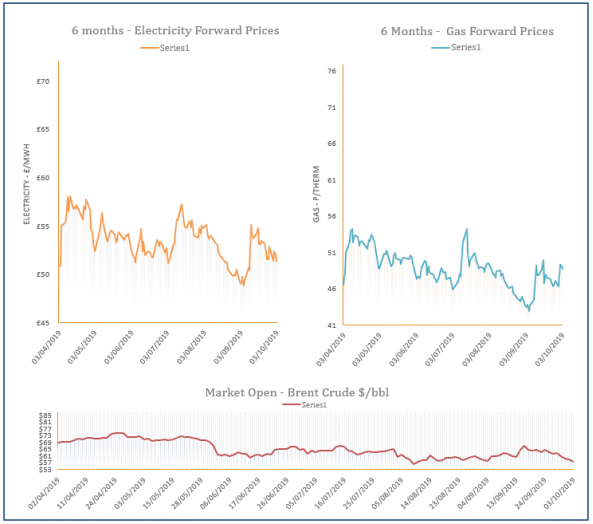
Energy Market Analysis – 03-10-2019
3rd October 2019 | Posted by: Daniel Birkett | Market Analysis
Gas prices moved down on Wednesday, following global energy markets, with coal, oil and carbon all recording losses. A few near-curve prices were the exception to the bearish trend, with support provided by higher demand.
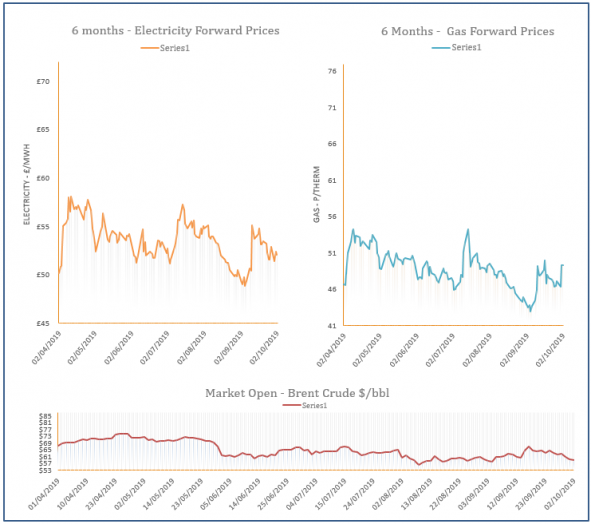
Energy Market Analysis – 02-10-2019
2nd October 2019 | Posted by: Daniel Birkett | Market Analysis
Gas prices initially opened at a discount but rebounded later in the session with the larger gains displayed at the front of the curve. Higher demand pushed the prompt higher which transferred to the front-month contract, while weaker coal limited upward movement on the far-curve.

Energy Market Analysis – 01-10-2019
1st October 2019 | Posted by: Daniel Birkett | Market Analysis
Near-curve gas prices moved down on the back of weaker demand levels, while storage levels were also at full capacity, adding to the bearish sentiment. Further out, contacts were generally stable despite another drop in oil and coal.