


Apollo Energy publishes a daily energy market analysis, focusing on the gas, power and oil markets including a commentary on how the markets close and open. Our analysis provides insight on how the markets are performing and also considers various factors which could dictate price changes in the future.
The analysis also contains a graph which tracks the one-year forward price of both gas and electricity as well as changes to Brent crude oil.
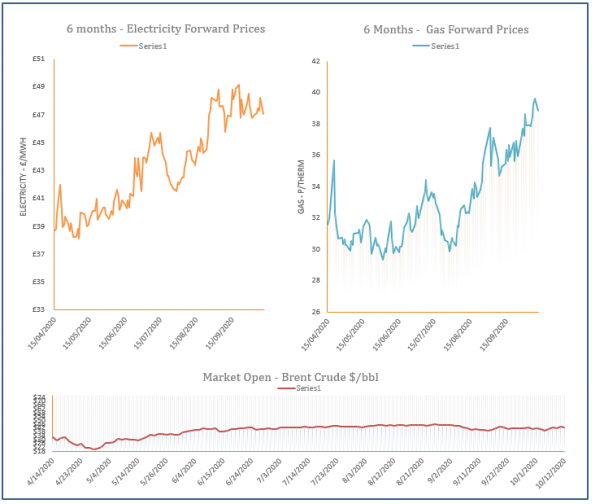
Energy Market Analysis – 12-10-2020
12th October 2020 | Posted by: Daniel Birkett | Market Analysis
Gas prices displayed some losses during Friday’s session, although the Day-Ahead contract found support from a weak renewable power and cold weather outlook for the weekend and today.
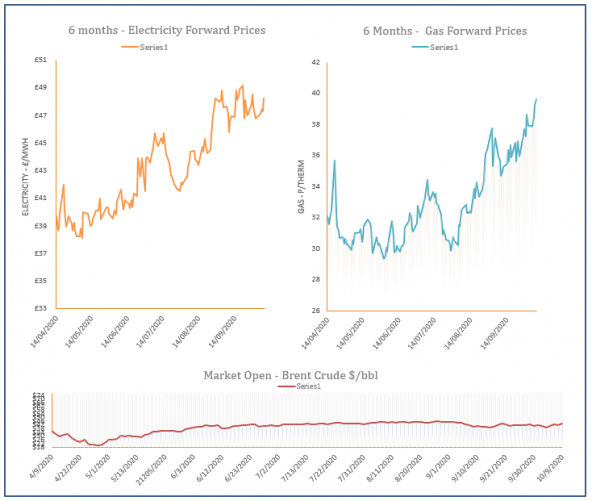
Energy Market Analysis – 09-10-2020
9th October 2020 | Posted by: Daniel Birkett | Market Analysis
Gas prices were pushed higher by a rallying oil market, with expected strike action at Norwegian oil & gas facilities also offering support. Colder weather continued to lift demand but its impact was offset by healthy LNG send-outs.
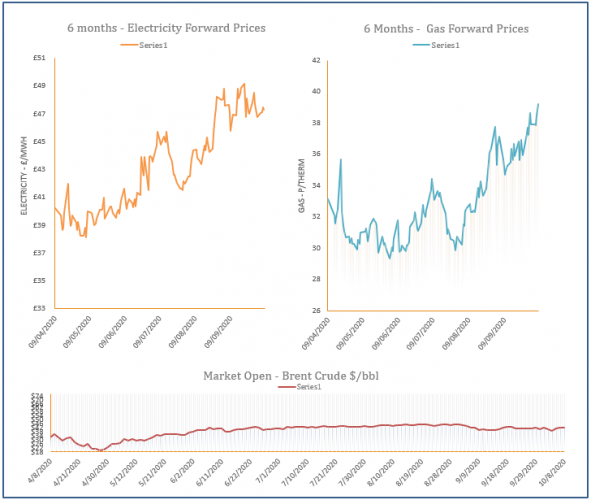
Energy Market Analysis – 08-10-2020
8th October 2020 | Posted by: Daniel Birkett | Market Analysis
Gas prices climbed higher yesterday, with the prompt finding support from an expected drop in renewable levels tomorrow, lifting demand for gas-fired power. Oil prices retraced slightly but overall sentiment on the far-curve remained bullish.

UK Energy Industry 2021 Changes and beyond
8th October 2020 | Posted by: Daniel Birkett | Industry News
The UK’s decision to leave the European Union will also directly impact the industry in terms of energy trading, legislation and overseas investment.
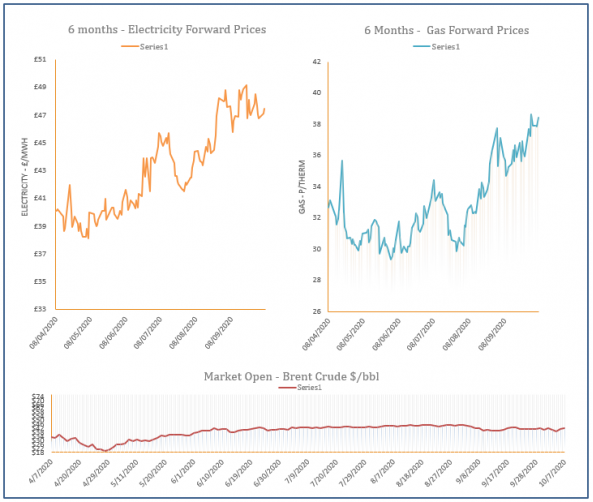
Energy Market Analysis – 07-10-2020
7th October 2020 | Posted by: Daniel Birkett | Market Analysis
Gas prices were generally stable throughout Tuesday’s session, with an oversupplied system helping to weigh on prices at the front of the curve. A rise in oil offered support further along the curve but any movement was minimal.