


Apollo Energy publishes a daily energy market analysis, focusing on the gas, power and oil markets including a commentary on how the markets close and open. Our analysis provides insight on how the markets are performing and also considers various factors which could dictate price changes in the future.
The analysis also contains a graph which tracks the one-year forward price of both gas and electricity as well as changes to Brent crude oil.
Energy Market Analysis – 06-10-2020
6th October 2020 | Posted by: Daniel Birkett | Market Analysis
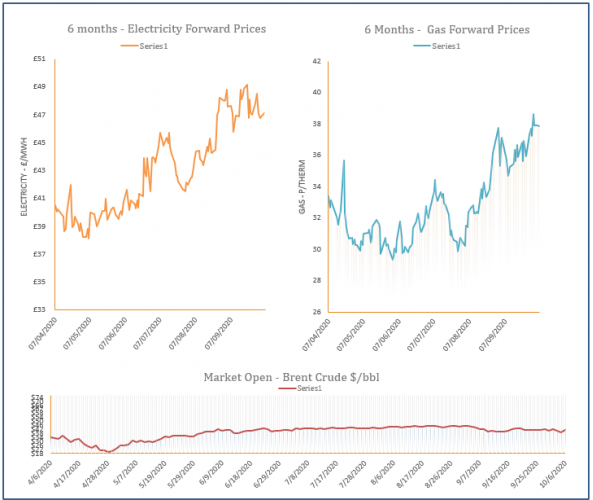
Gas prices recorded gains yesterday, taking direction from a rebound in oil and a recovery on the overall energy market. Carbon was the only market to trade sideways, while the front of the curve was pushed higher by an undersupplied system.

Energy Market Analysis – 05-10-2020
5th October 2020 | Posted by: Daniel Birkett | Market Analysis
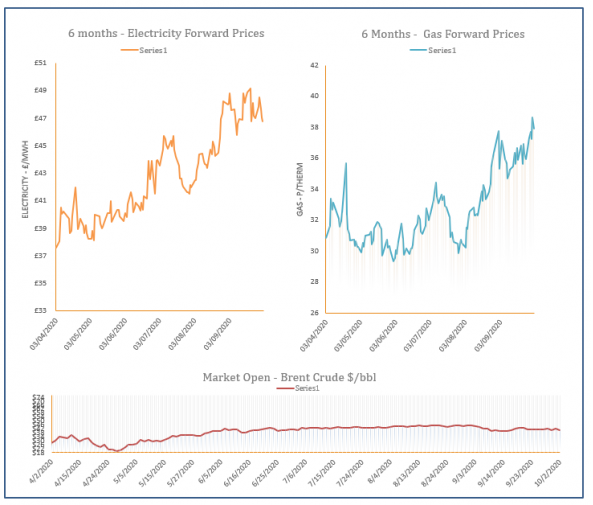
Gas prices moved down on Friday, pressured down by a weakening oil markets which also transferred to carbon, coal and power contracts. Meanwhile, the prompt found support from a cooler weather and weak renewable power forecast for this week.
Energy Market Analysis – 02-10-2020
2nd October 2020 | Posted by: Daniel Birkett | Market Analysis
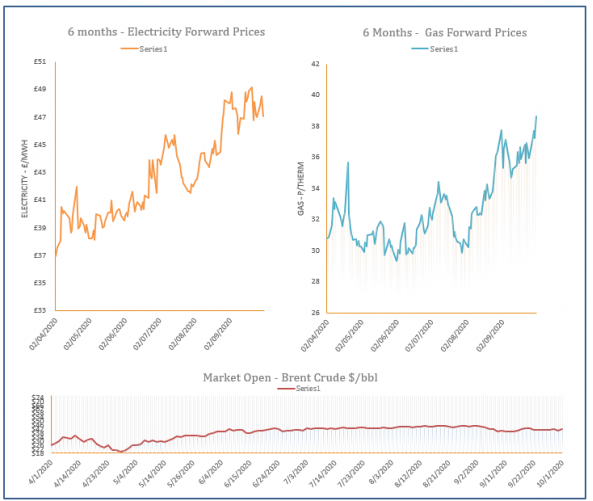
Gas prices followed the overall energy complex and displayed losses on Thursday, with oil, coal and carbon all trading lower. Healthy supply from Norway also resulted in an oversupplied system, with a strong rise in wind generation expected today, reducing demand for gas-fired power.
Energy Market Analysis – 01-10-2020
1st October 2020 | Posted by: Daniel Birkett | Market Analysis
Gas prices displayed heavy losses yesterday before the start of Q1-21, as traders reset their positions, with winter heating expected to ramp up in the coming months. Contracts decreased across the curve, ignoring a rise in oil, coal and carbon.