


Apollo Energy publishes a daily energy market analysis, focusing on the gas, power and oil markets including a commentary on how the markets close and open. Our analysis provides insight on how the markets are performing and also considers various factors which could dictate price changes in the future.
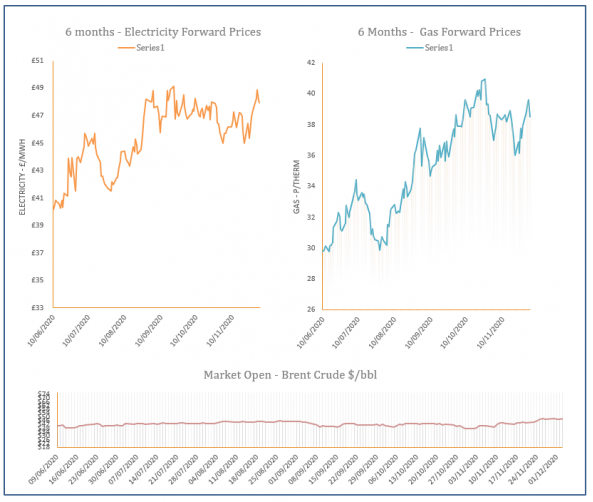
The analysis also contains a graph which tracks the one-year forward price of both gas and electricity as well as changes to Brent crude oil.
Energy Market Analysis – 03-12-2020
3rd December 2020 | Posted by: Daniel Birkett | Market Analysis
Near curve gas prices moved higher once again on the back of the tighter demand outlook, although a long system ensured gains were not significant. Further out, contracts found some support from an increase in oil and carbon.

Energy Market Analysis – 02-12-2020
2nd December 2020 | Posted by: Daniel Birkett | Market Analysis
Cold weather and limited renewable generation is expected to lift gas demand over the coming weeks which helped the near curve rally higher yesterday morning. Prices ended the session practically unchanged as most contracts eased down in the afternoon due to a drop in coal and oil.

Energy Market Analysis – 01-12-2020
1st December 2020 | Posted by: Daniel Birkett | Market Analysis
Gas prices were pushed higher during Monday’s session as a cold weather outlook and reduced renewable power is set to tighten the gas system over the coming week. Further gains on commodity markets also helped the far curve to strengthen.