


Apollo Energy publishes a daily energy market analysis, focusing on the gas, power and oil markets including a commentary on how the markets close and open. Our analysis provides insight on how the markets are performing and also considers various factors which could dictate price changes in the future.
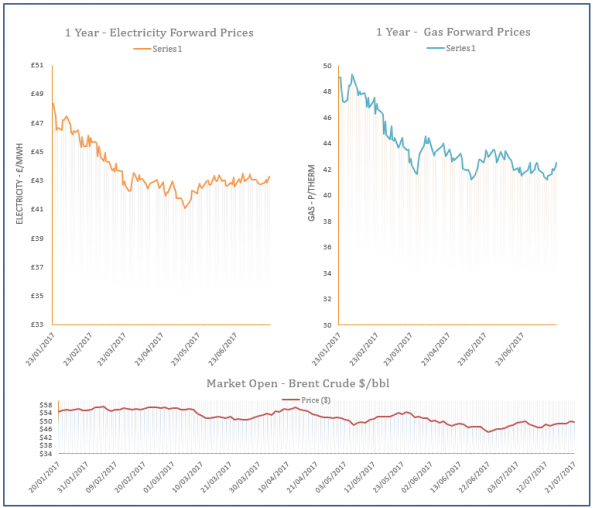
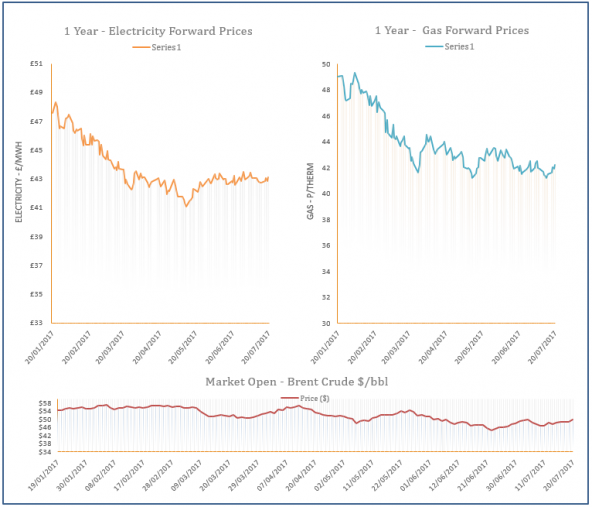
The analysis also contains a graph which tracks the one-year forward price of both gas and electricity as well as changes to Brent crude oil.
Energy Market Analysis - 21-07-2017
21st July 2017 | Posted by: Daniel Birkett | Market Analysis
The on-going outage at the Kollsnes processing plant continued to restrict Norwegian flows into the UK, although outages at the Troll and Kvitebjorn fields have been resolved. These supply restrictions supported contracts on the near-curve, with a weaker Pound also a bullish factor.

New UK Oil & Gas Guidelines Published
21st July 2017 | Posted by: Daniel Birkett | Industry News
New Guidelines for the UK’s oil and gas industry have been published to help boost production.
Energy Market Analysis - 20-07-2017
20th July 2017 | Posted by: Daniel Birkett | Market Analysis
Gas prices were relatively stable on Wednesday as the majority of fundamentals were largely unchanged. Coal prices increased in the morning but fell later in the session and gas-fired power demand was down due to healthier renewable generation.

Energy Market Analysis - 19-07-2017
19th July 2017 | Posted by: Daniel Birkett | Market Analysis
Rising coal prices and a short system did little to prevent gas contracts recording a loss yesterday, with the majority managing to erase Monday’s gains. An improved supply/ demand outlook helped to weigh on prices as Norwegian flows are set to rise and strong wind levels will reduce CCGT demand.

Energy Market Analysis - 18-07-2017
18th July 2017 | Posted by: Daniel Birkett | Market Analysis
Gas prices increased on Monday as the system was undersupplied throughout the session and further support was provided by a rise in Brent. Demand levels were 14mcm above average for this time of year and the system started the session 9mcm short. On the far-curve, prices were dictated by rising oil on the back of a lower rig count in the US.