Apollo Energy publishes a daily energy market analysis, focusing on the gas, power and oil markets including a commentary on how the markets close and open. Our analysis provides insight on how the markets are performing and also considers various factors which could dictate price changes in the future.
The analysis also contains a graph which tracks the one-year forward price of both gas and electricity as well as changes to Brent crude oil.
Energy Market Analysis - 20-04-2017
20th April 2017 | Posted by: Daniel Birkett | Market Analysis
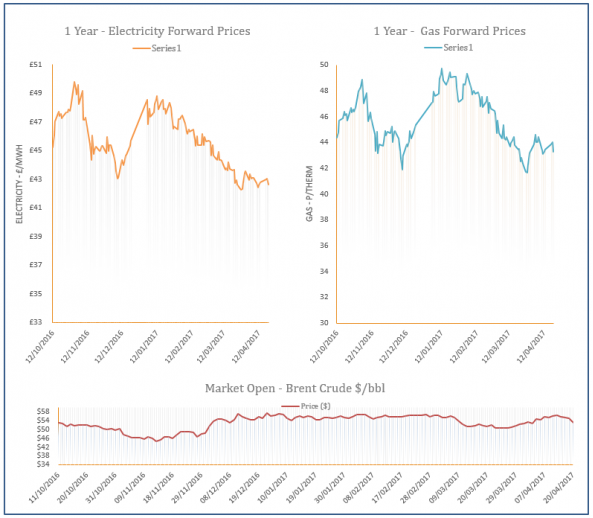
Weaker oil prices helped to weigh on the gas market towards the end of yesterday’s session. Contracts were stable for most of the day following early morning gains which were caused by planned production cuts at the Dutch Groningen facility. Meanwhile, temperatures were forecast to be below average for the remainder of this month, offering further support at the start of the session.
Energy Market Analysis - 19-04-2017
19th April 2017 | Posted by: Daniel Birkett | Market Analysis
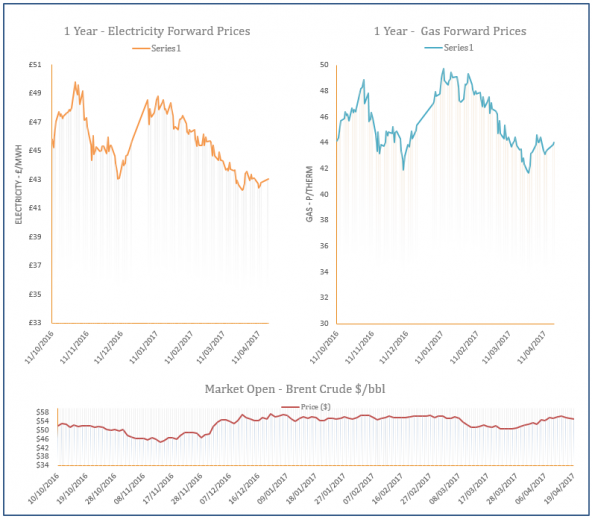
Production at the Groningen gas facility will be cut by 10% in the 2017/18 gas year, falling from 24bcm to 21.6bcm; this resulted in strong upward movement on European markets. Meanwhile, the Pound weakened following Theresa May’s call for a snap election, slightly limiting gains at the front of the curve and offering support to those further out. Temperatures are also expected to remain below average for the rest of April, further contributing to the bullish sentiment.
The Snap Election will not impact the next CfD auction
19th April 2017 | Posted by: Daniel Birkett | Industry News
The government has confirmed that the snap election will not postpone the next Contracts for Difference (CfD) auction.
Energy Market Analysis - 18-04-2017
18th April 2017 | Posted by: Daniel Birkett | Market Analysis
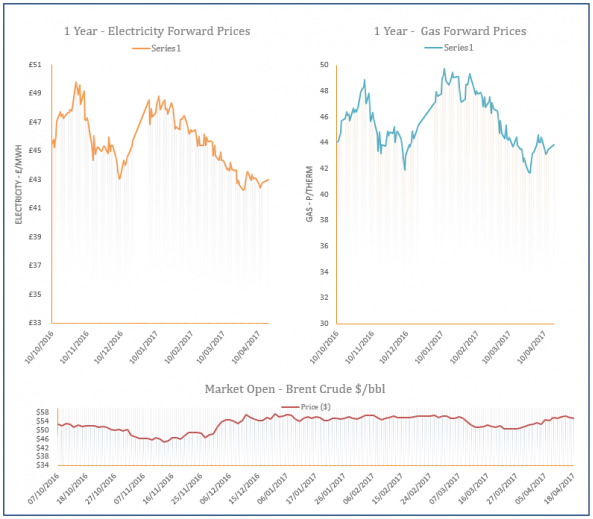
An announcement by Centrica confirmed that the Rough storage facility would be unavailable until May 2018 at the earliest, applying bullish pressure to the gas curve at the end of last week. Supply levels were generally healthy but a cooler weather forecast for the weekend and the start of this week restricted any downward movement.
Energy Market Analysis - 13-04-2017
13th April 2017 | Posted by: Daniel Birkett | Market Analysis
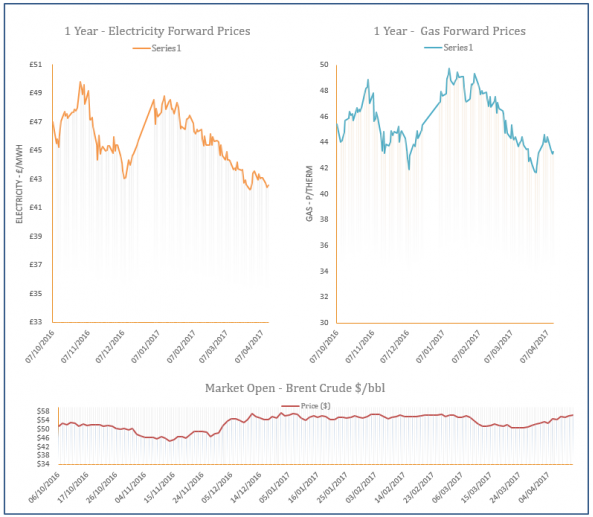
Gas prices displayed mixed movement yesterday following an announcement by Centrica confirming that the Rough storage facility would be unavailable until May 2018 at the earliest, read more here. Comfortable supply levels provided some bearish pressure at the front of the curve, while stronger oil supported contracts on the far-curve.


