


Apollo Energy publishes a daily energy market analysis, focusing on the gas, power and oil markets including a commentary on how the markets close and open. Our analysis provides insight on how the markets are performing and also considers various factors which could dictate price changes in the future.
The analysis also contains a graph which tracks the one-year forward price of both gas and electricity as well as changes to Brent crude oil.
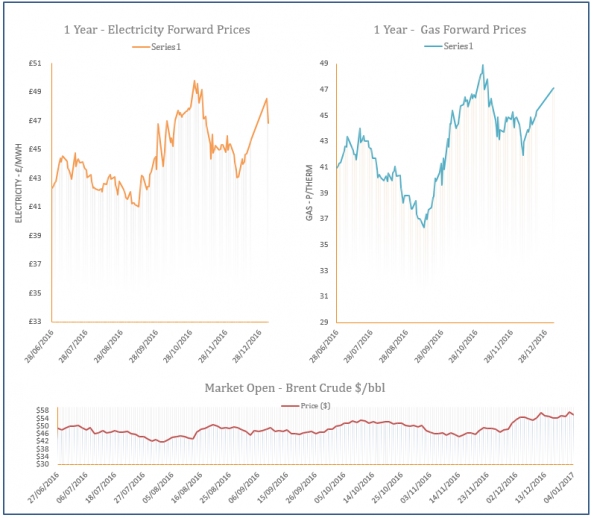
Energy Market Analysis - 04-01-2017
4th January 2017 | Posted by: Daniel Birkett | Market Analysis
Gas contracts moved down yesterday with a milder weather forecast for this month and an oversupplied system weighing on prices across the near-curve. A drop in oil and coal prices later in the session also helped to weigh on contracts further along the curve. Elsewhere, Russian flows via the OPAL pipeline increased following a decision by the EU commission to raise its capacity, while the Pound also strengthened against the Euro.
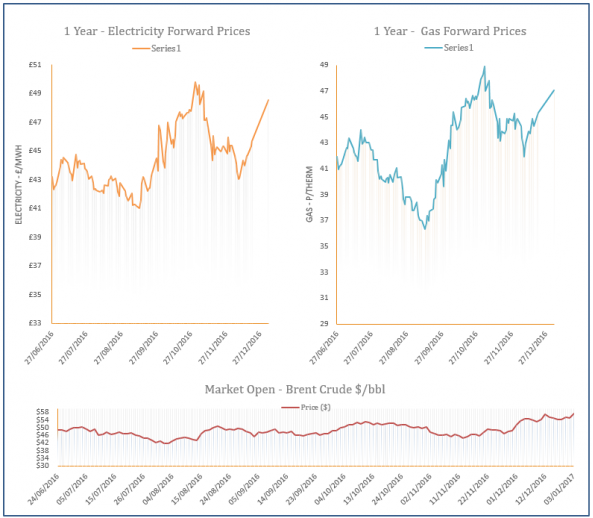
Energy Market Analysis - 03-01-2017
3rd January 2017 | Posted by: Daniel Birkett | Market Analysis
Gas markets were bullish at the end of 2016 with colder weather forecasts and an increase in coal and oil contracts offering support. Further maintenance at the Rough storage facility was also scheduled to take place until the 4th of January which led to a reduction in withdrawal capacity; resulting in an increase in European imports.

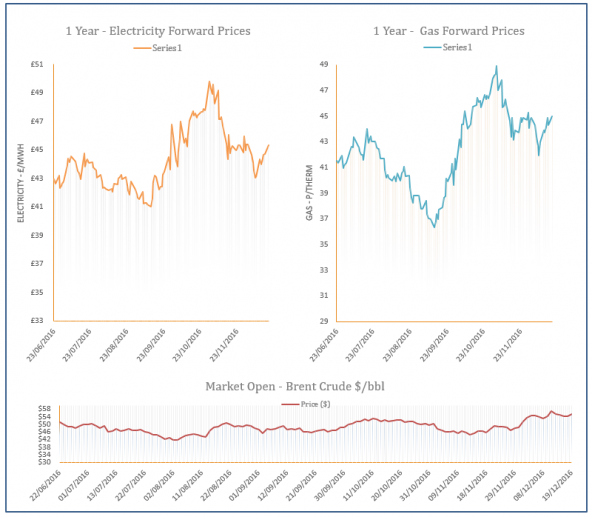
Energy Market Analysis - 20-12-2016
20th December 2016 | Posted by: Daniel Birkett | Market Analysis
After a relatively quiet day of trading, gas prices ended on a bullish note, with a combination of a weaker pound against the euro and news of a new outage which will cut Rough withdrawals until 1st January helping to curb early losses.
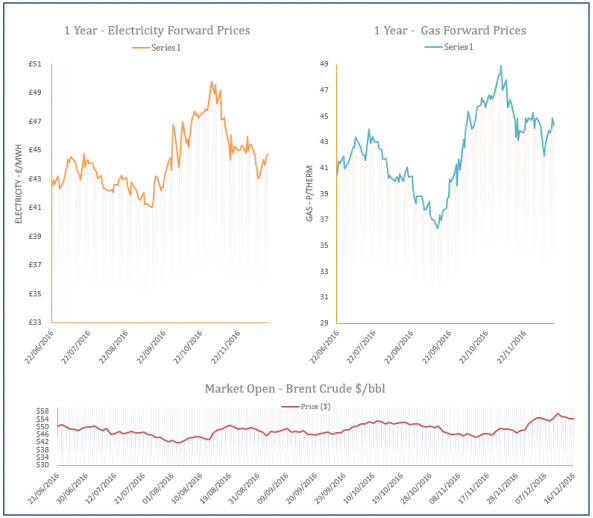
Energy Market Analysis - 19-12-2016
19th December 2016 | Posted by: Daniel Birkett | Market Analysis
Gas prices ended the week on a bullish note, supported by an intraday unplanned outage at Rough storage facility on Friday, colder weather forecasts for the week ahead and strong coal and oil prices.
Energy Market Analysis - 16-12-2016
16th December 2016 | Posted by: Daniel Birkett | Market Analysis
A stronger US Dollar, following the decision at the latest Federal Interest Rate meeting offered some support to the gas curve yesterday but the overall trend was bearish throughout the session. The main market driver was mild weather which has resulted in weak demand levels, keeping storage withdrawals to a minimum.