


Apollo Energy publishes a daily energy market analysis, focusing on the gas, power and oil markets including a commentary on how the markets close and open. Our analysis provides insight on how the markets are performing and also considers various factors which could dictate price changes in the future.
The analysis also contains a graph which tracks the one-year forward price of both gas and electricity as well as changes to Brent crude oil.

Energy Market Update - Autumn Budget 2016
24th November 2016 | Posted by: Daniel Birkett | Industry News
Carbon Price Support rates, Levy Control Framework and future carbon prices were the key points in yesterday's Budget announcement in regards to the energy sector.
Energy Market Analysis - 23-11-2016
23rd November 2016 | Posted by: Daniel Birkett | Market Analysis
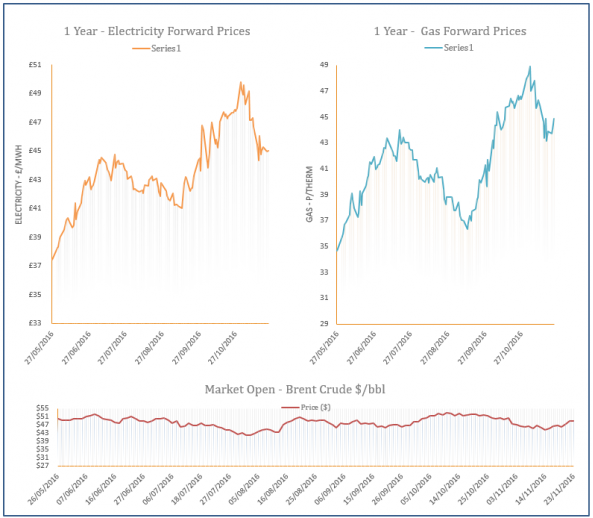
The Bacton Seal terminal suffered an unplanned outage yesterday which reduced UKCS production, with flows via St Fergus also limited due to maintenance. This resulted in a rebound on the near-curve, while rising oil and coal prices were supportive further out.

Energy Market Analysis - 22-11-2016
22nd November 2016 | Posted by: Daniel Birkett | Market Analysis
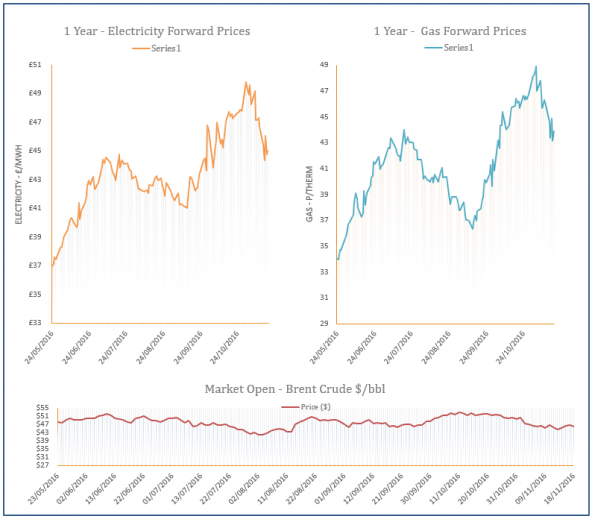
Gas contracts recorded losses on Monday with a milder weather forecast resulting in bearish movement on the near-curve. Improved imports from Norway and mainland Europe resulted in a long gas system which helped the prompt to shed from its price. However, an increase in oil prices restricted some of the downward movement on the far-curve.

Energy Market Analysis - 21-11-2016
21st November 2016 | Posted by: Daniel Birkett | Market Analysis
Gas prices moved higher on Friday afternoon with an unplanned outage at the St Fergus terminal reducing UKCS flows, resulting in a short gas system. St Fergus is also set to undergo scheduled maintenance from the 20th of November until the 18th of December; limiting output by 12mcm/ day. A milder weather forecast for this week restricted some of the gains on the near-curve, while falling coal and oil limited upward movement further out.
Energy Market Analysis - 18-11-2016
18th November 2016 | Posted by: Daniel Birkett | Market Analysis
Gas systems across Europe were comfortable yesterday which helped towards losses on the near-curve. An increase in imports from Norway and Belgium contributed to a long UK gas system despite a 29mccm rise in demand levels. Temperatures are also expected to turn milder next week which was another factor behind the downward trend.