


Apollo Energy publishes a daily energy market analysis, focusing on the gas, power and oil markets including a commentary on how the markets close and open. Our analysis provides insight on how the markets are performing and also considers various factors which could dictate price changes in the future.
The analysis also contains a graph which tracks the one-year forward price of both gas and electricity as well as changes to Brent crude oil.
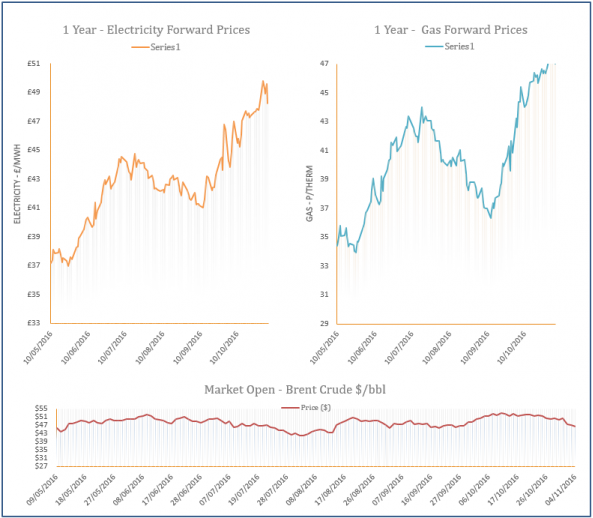
Energy Market Analysis - 04-11-2016
4th November 2016 | Posted by: Daniel Birkett | Market Analysis
Gas prices moved down yesterday afternoon, erasing some of the morning’s strong gains, with comfortable gas systems across Europe providing bearish pressure. Concerns regarding power supply over the winter period offered support at the start of the session but higher imports into the UK from Belgium and falling Brent helped contracts record a loss.
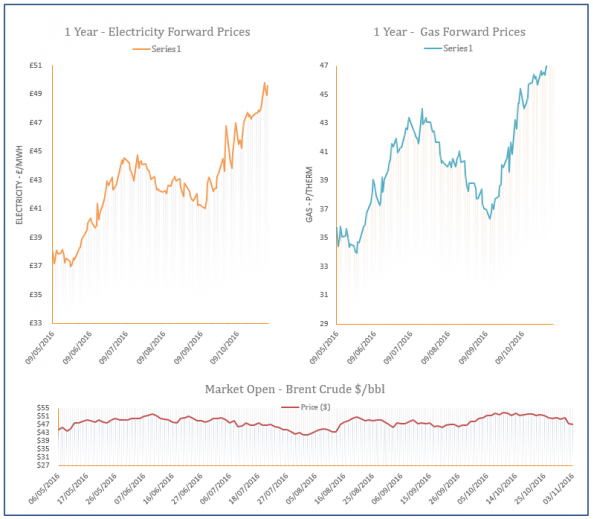
Energy Market Analysis - 03-11-2016
3rd November 2016 | Posted by: Daniel Birkett | Market Analysis
A below average weather forecast and concerns regarding power supply over the coming months helped to push gas contracts higher on Wednesday. Scheduled maintenance in Norway on Friday will also reduce flows by 20mcm, while LNG supply will remain weak. A delayed restart in withdrawals from the Rough storage facility was another supportive factor and cold temperatures led to a 15% rise in residential demand.

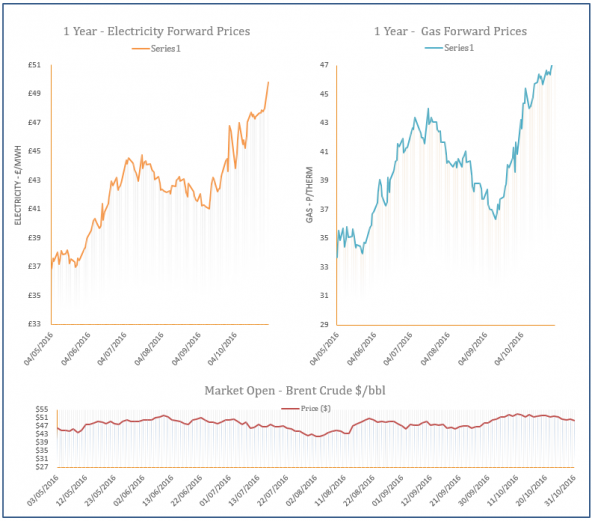
Energy Market Analysis - 02-11-2016
2nd November 2016 | Posted by: Daniel Birkett | Market Analysis
An expected drop in temperatures over the next fortnight helped to push prompt gas contracts higher yesterday, with further support coming from a delayed restart in withdrawals from the Rough storage facility. LNG supply was tight with only two deliveries scheduled to dock in the UK this month, while Norwegian imports remained low. Contracts further along the curve also found support from a sharp rise in APi2 coal.

Energy Market Analysis - 01-11-2016
1st November 2016 | Posted by: Daniel Birkett | Market Analysis
Sentiment on the gas curve was bullish on Monday with an expected drop in temperatures, increased gas-fired generation and limited Norwegian flows combining to push contracts higher. Brent also strengthened in the afternoon and contributed to upward movement further along the curve, with rising coal prices also a factor.
Energy Market Analysis - 31-10-2016
31st October 2016 | Posted by: Daniel Birkett | Market Analysis
Gas prices were generally stable on Friday with the morning’s losses erased by increases on the power market in the afternoon. Bearish Brent helped to restrict some of the upward movement on the far-curve, while news regarding a potential rise in Russian flows to Europe also limited gains.