


Apollo Energy publishes a daily energy market analysis, focusing on the gas, power and oil markets including a commentary on how the markets close and open. Our analysis provides insight on how the markets are performing and also considers various factors which could dictate price changes in the future.
The analysis also contains a graph which tracks the one-year forward price of both gas and electricity as well as changes to Brent crude oil.

Market Update - Rising Rig Counts weighing on Oil Prices
12th September 2016 | Posted by: Daniel Birkett | Industry News
Crude oil prices display a sizeable loss this morning as oil drillers in the US continue to add more rigs, resulting in high levels of production.

Energy Market Analysis - 12-09-2016
12th September 2016 | Posted by: Daniel Birkett | Market Analysis
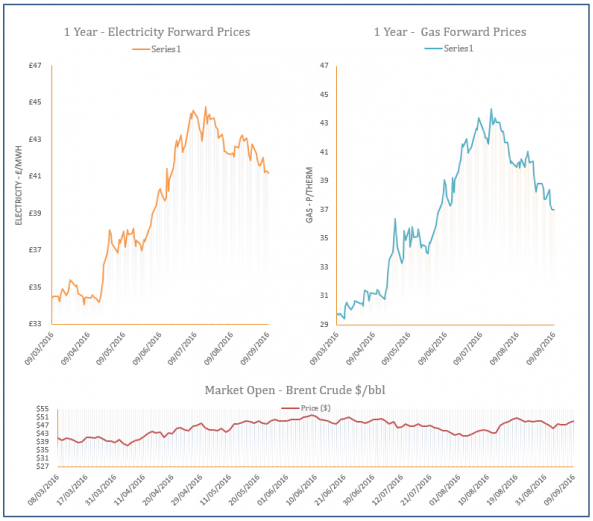
Gas contracts moved down on Friday on the back of an improved supply outlook, as outages at Norwegian and Russian facilities were resolved. The UK gas system was well-supplied throughout the session which pressured down the prompt, with the losses filtering through to the rest of the near-curve. Meanwhile, falling Brent erased some of the morning’s gains on the far-curve.
Energy Market Analysis - 09-09-2016
9th September 2016 | Posted by: Daniel Birkett | Market Analysis
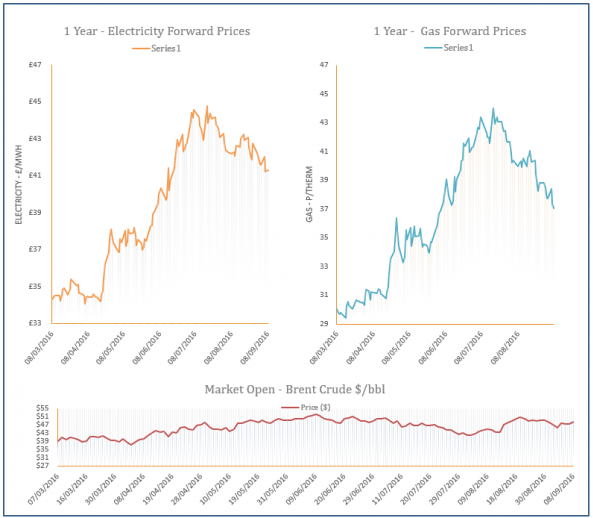
Day-Ahead gas decreased during yesterday’s session due to a heavily oversupplied system following a rise in Norwegian flows via the Langeled pipeline and higher UKCS production. Meanwhile, stronger wind power resulted in a decrease in gas-fired generation, reducing demand. Losses were evident across the near-curve but contracts further out found support from an increase in Brent.
Energy Market Analysis - 08-09-2016
8th September 2016 | Posted by: Daniel Birkett | Market Analysis
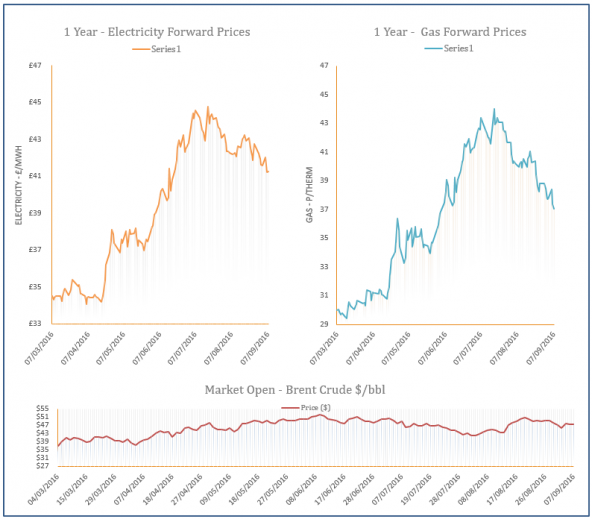
The UK gas system was oversupplied on Wednesday following a rise in UKCS flows via Bacton Seal, while a jump in wind levels led to a decrease in gas-fired power generation. Meanwhile, LNG send-outs were above 50mcm with numerous deliveries expected to arrive from Qatar over the next fortnight. This healthier supply picture helped near-curve gas contracts to fall but rising Brent provided support further out.
Energy Market Analysis - 07-09-2016
7th September 2016 | Posted by: Daniel Birkett | Market Analysis
Gas contracts displayed mixed movement on Tuesday with the prompt adding to its price later in the session, while the far-curve displayed numerous losses. The UK gas system was short throughout the day which helped near-curve contracts move higher, while stable Brent helped contracts further out decrease.