


Apollo Energy publishes a daily energy market analysis, focusing on the gas, power and oil markets including a commentary on how the markets close and open. Our analysis provides insight on how the markets are performing and also considers various factors which could dictate price changes in the future.
The analysis also contains a graph which tracks the one-year forward price of both gas and electricity as well as changes to Brent crude oil.
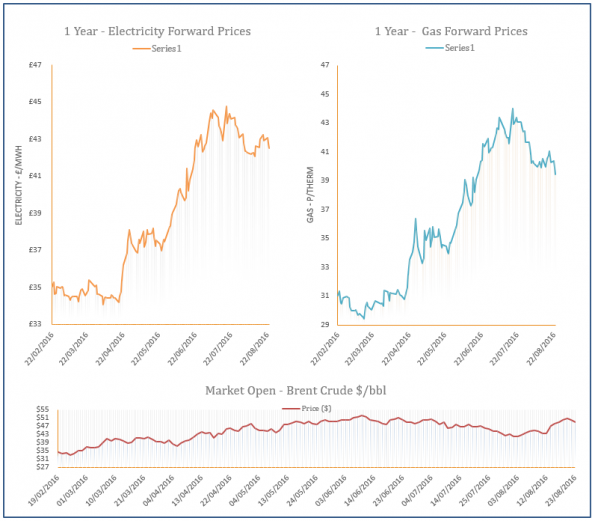
Energy Market Analysis - 23-08-2016
23rd August 2016 | Posted by: Daniel Birkett | Market Analysis
News that the 20 wells would be available at the Rough storage facility from the 1st of November helped the Winter-16 contract shed from its price yesterday. The losses filtered through to the far-curve with the help of weakening Brent. At the front of the curve, prices also moved down in the afternoon with the exception of the prompt following a bullish opening caused by an undersupplied system.

Market Update - More wells to be made available at Rough
23rd August 2016 | Posted by: Daniel Birkett | Industry News
Twenty storage wells are to be made available for withdrawals at Centrica’s Rough facility from the 1st of November; easing supply concerns.
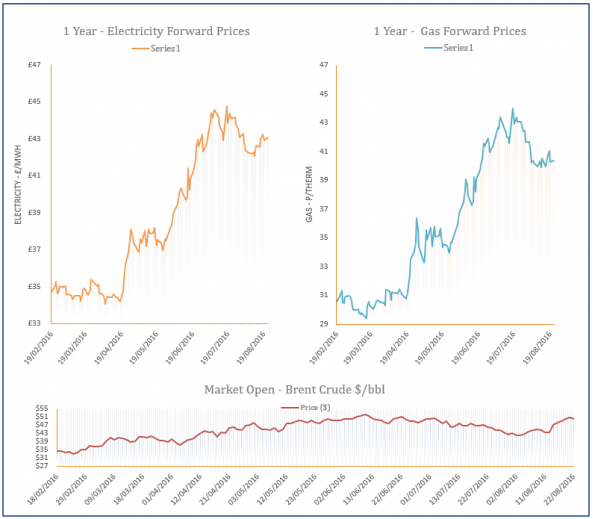
Energy Market Analysis - 22-08-2016
22nd August 2016 | Posted by: Daniel Birkett | Market Analysis
Gas contracts moved down on Friday as the Nord Stream interconnector returned online as seasonal maintenance was completed. In terms of the UK, healthy levels of wind power resulted in reduced coal-fired power generation, while UKCS production also improved, contributing to a long gas system.
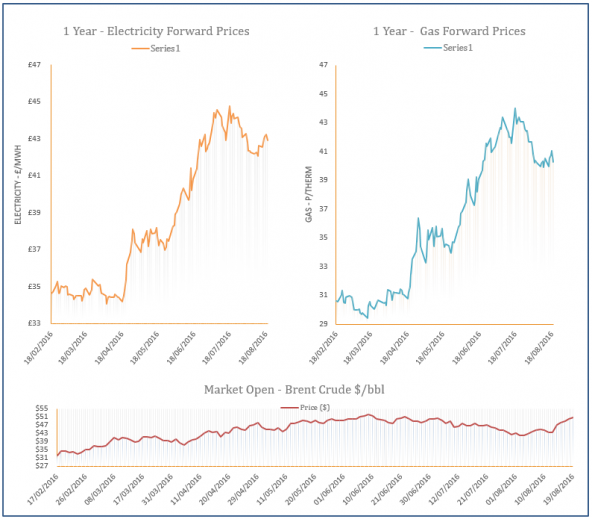
Energy Market Analysis - 19-08-2016
19th August 2016 | Posted by: Daniel Birkett | Market Analysis
The UK gas system was short for the majority of yesterday’s session but became balanced in the afternoon which resulted in a downward correction on the near-curve. Prompt prices were also pressured down by an announcement that the Nord Stream interconnector between Russia and Germany would return online today. Contracts further along the curve also displayed small losses on the back of currency movements, ignoring a rise in Brent.
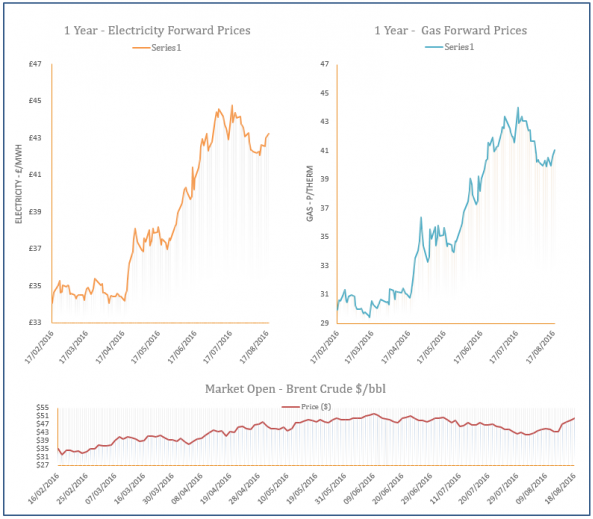
Energy Market Analysis - 18-08-2016
18th August 2016 | Posted by: Daniel Birkett | Market Analysis
The UK gas system moved into oversupply yesterday which applied downward pressure on the near-curve in the afternoon, during a session of mixed movement. The system was 20mcm long, helped by weaker demand and resulted in a loss on the prompt. Further out, an increase in oil prices helped contracts climb higher, ignoring a rebound in the Pound.