


Apollo Energy publishes a daily energy market analysis, focusing on the gas, power and oil markets including a commentary on how the markets close and open. Our analysis provides insight on how the markets are performing and also considers various factors which could dictate price changes in the future.
The analysis also contains a graph which tracks the one-year forward price of both gas and electricity as well as changes to Brent crude oil.
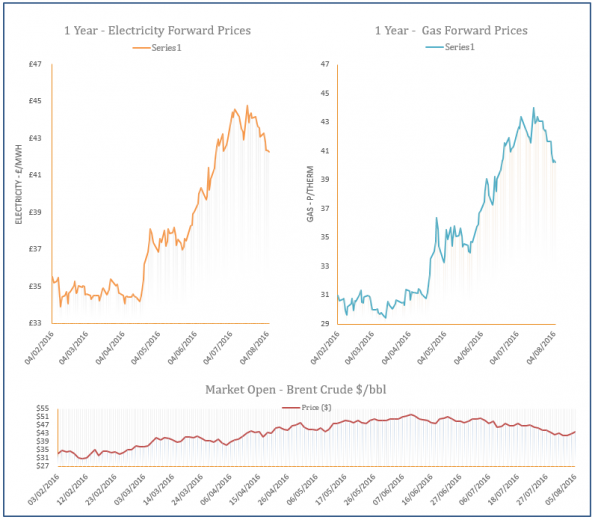
Energy Market Analysis - 05-08-2016
5th August 2016 | Posted by: Daniel Birkett | Market Analysis
Yesterday, Centrica announced the withdrawal rate of the Rough storage unit which is down to just 4 wells (as reported here). It was revealed that the minimum rate of withdrawal over the winter period would be 4mcm, with a maximum of 6-7mcm. However, this announcement had little impact on yesterday’s prices which were pushed higher by weak supply levels and stronger Brent.

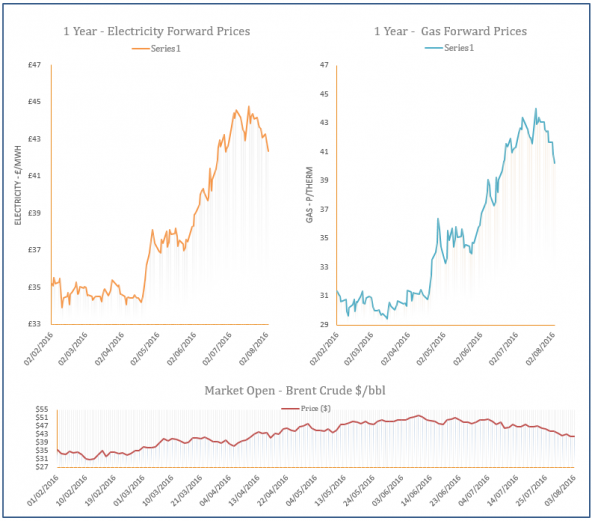
Energy Market Analysis - 04-08-2016
4th August 2016 | Posted by: Daniel Birkett | Market Analysis
Demand for gas-fired power generation fell yesterday as wind power rose significantly, providing downward pressure on the near-curve. Prompt contracts moved down despite a drop in Norwegian flows and the start of maintenance at UKCS facilities, while a rebound in oil prices limited the losses on the far-curve.
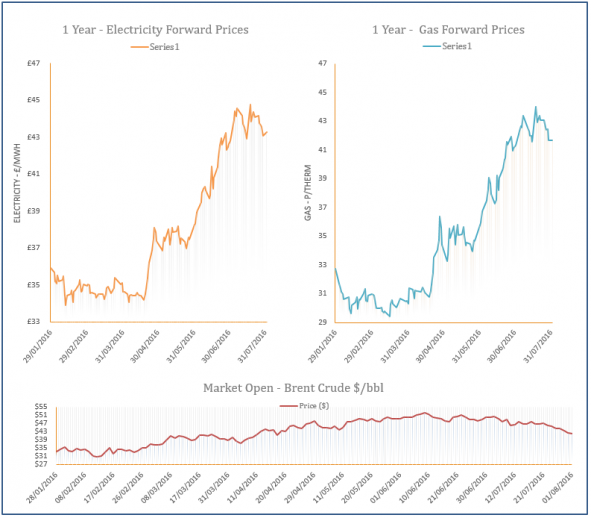
Energy Market Analysis - 03-08-2016
3rd August 2016 | Posted by: Daniel Birkett | Market Analysis
Gas prices continued to move down during Tuesday’s session despite weaker imports from Norway and the start of maintenance at the Britannia gas field. Elsewhere, a rise in Russian gas flows via Ukraine helped to weigh on European prices which also applied downward pressure on some corresponding UK contracts. Meanwhile, Brent recorded another loss which resulted in further downward movement on the far-curve.

Energy Market Analysis - 02-08-2016
2nd August 2016 | Posted by: Daniel Birkett | Market Analysis
Falling oil prices helped to pressure down contracts on the far-curve yesterday although movement on the prompt was bullish due to a drop in Norwegian supply and the start of scheduled maintenance work at facilities in the UK; however, another drop in exports to Belgium via the IUK pipeline helped to limit some of the gains.
Energy Market Analysis - 01-08-2016
1st August 2016 | Posted by: Daniel Birkett | Market Analysis
Gas contracts decreased on Friday with improved supply levels helping to weigh on the near-curve and weak oil contributing to bearish movement further out. Norwegian imports into the UK increased as a couple of outages were resolved and this resulted in a long UK gas system.