


Apollo Energy publishes a daily energy market analysis, focusing on the gas, power and oil markets including a commentary on how the markets close and open. Our analysis provides insight on how the markets are performing and also considers various factors which could dictate price changes in the future.
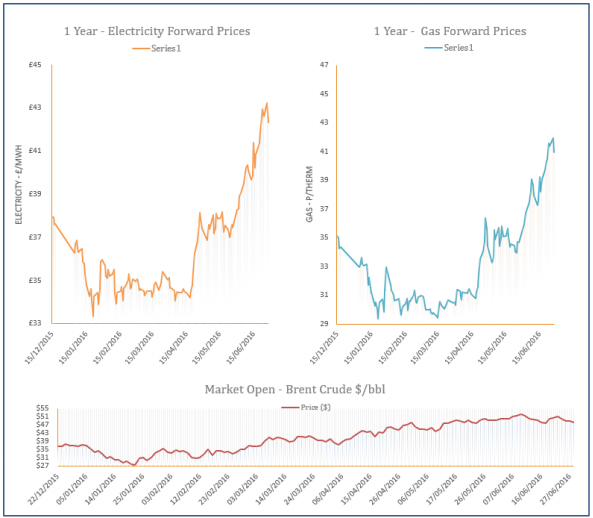
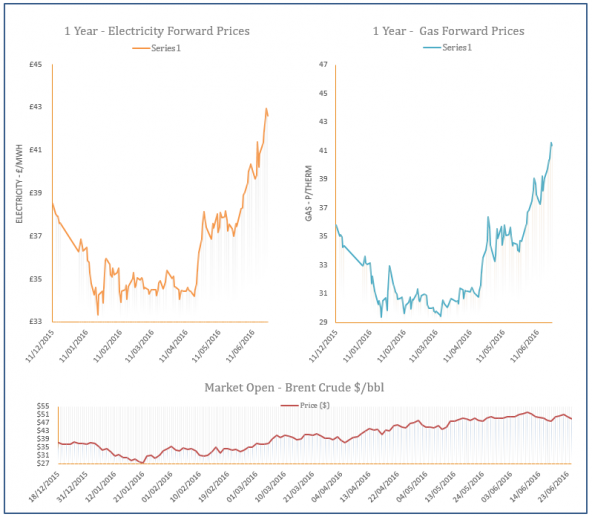
The analysis also contains a graph which tracks the one-year forward price of both gas and electricity as well as changes to Brent crude oil.

Brexit and its potential impact on UK Energy
29th June 2016 | Posted by: Daniel Birkett | Industry News
Volatility on the gas and energy markets has been evident since last Thursday’s EU referendum, with 52% voting in favour of ‘leave’. This has led to the Pound Sterling weakening against other major currencies, resulting a great deal of uncertainty amongst traders. However, the drop in the Pound isn’t the sole reason for this strong market movement.

Energy Market Analysis - 29-06-2016
29th June 2016 | Posted by: Daniel Birkett | Market Analysis
Gas systems across Europe were balanced yesterday thanks to a rise in imports from Norway, resulting in downward movement across the gas-curve. A drop in oil prices also helped to weigh on far-curve contracts, assisted by a weakening Pound.
Energy Market Analysis - 28-06-2016
28th June 2016 | Posted by: Daniel Birkett | Market Analysis
Gas prices decreased yesterday afternoon as the UK gas system was balanced throughout the session following a rise in supply. The Pound also weakened further against the Euro which resulted in some losses on Euro-traded contracts, while a drop in Brent pressured down prices on the far-curve.

Energy Market Analysis - 27-06-2016
27th June 2016 | Posted by: Daniel Birkett | Market Analysis
A drop in the Pound resulted in strong upward movement on the UK gas curve on Friday, although Euro-traded contracts posted losses. Elsewhere, the Dutch Economic Affairs Minister made a preliminary decision to cap production at the Groningen gas facility over the next five years; reducing output from 27bcm to 24bcm.
Energy Market Analysis - 24-06-2016
24th June 2016 | Posted by: Daniel Birkett | Market Analysis
Profit taking by traders resulted in losses on the gas curve yesterday, while overall fundamentals were generally comfortable. Demand levels weakened which contributed to downward movement on the near-curve and weakening oil prices pressured down contracts further out.