


Apollo Energy publishes a daily energy market analysis, focusing on the gas, power and oil markets including a commentary on how the markets close and open. Our analysis provides insight on how the markets are performing and also considers various factors which could dictate price changes in the future.
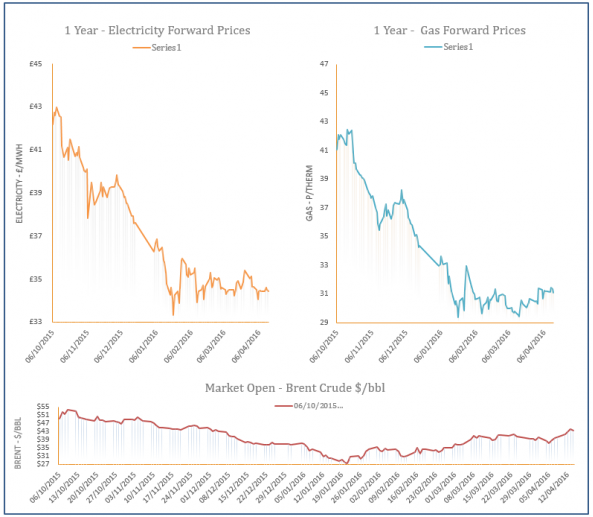
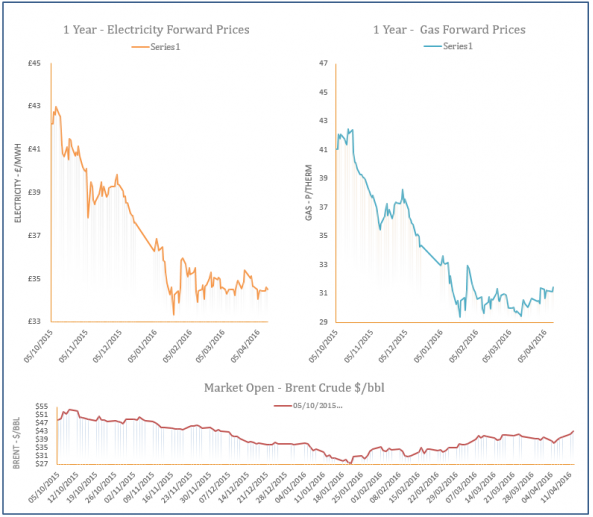
The analysis also contains a graph which tracks the one-year forward price of both gas and electricity as well as changes to Brent crude oil.

Energy Market Analysis - 18-04-2016
18th April 2016 | Posted by: Daniel Birkett | Market Analysis
The gas curve displayed very little movement on Friday as traders were reluctant to commit ahead of Sunday’s meeting between OPEC members and Russia in regards to a potential freeze deal for oil. Contracts on the near-curve were slightly supported by a short UK gas system as the outage at the Kollsnes processing facility remained unresolved, reducing Norwegian flows into the UK.

Energy Market Analysis - 15-04-2016
15th April 2016 | Posted by: Daniel Birkett | Market Analysis
The outage at the Kollsnes processing facility remained unresolved yesterday, limiting Norwegian gas flows into the UK and offering support to the prompt. However, this drop in supply had little effect on the rest of the near-curve which was generally unchanged, while weaker Brent helped to weigh on prices further out.
Energy Market Analysis - 14-04-2016
14th April 2016 | Posted by: Daniel Birkett | Market Analysis
Near-curve gas prices displayed a small increase towards the end of yesterday’s session as Norwegian flows into the UK fell due to an unplanned outage at the Kollsnes processing facility. Movement further along the curve was generally bearish with a milder weather outlook and weaker Brent weighing on contracts.
Energy Market Analysis - 13-04-2016
13th April 2016 | Posted by: Daniel Birkett | Market Analysis
An increase in exports to Belgium, weaker UKCS flows and a rise in gas-fired power generation left the UK gas system in short supply yesterday; supporting prices on the near-curve. The drop in UKCS production was a result of unplanned maintenance work, restricting supply to the St Fergus terminal. Gains were also visible further out as contracts were dictated by rising Brent.

Energy Market Analysis - 12-04-2016
12th April 2016 | Posted by: Daniel Birkett | Market Analysis
Most gas contracts posted losses on Monday as demand levels were weaker on the back of milder temperatures in the UK. Strong wind levels also lessened the UK’s reliance on gas-fired generation, further reducing demand. Meanwhile, LNG send-outs increased with several deliveries set to arrive in the UK over the next few days, leading to an oversupplied system. Further along the curve a stronger Pound offset rising oil prices and the majority of prices stabilised.