


Apollo Energy publishes a daily energy market analysis, focusing on the gas, power and oil markets including a commentary on how the markets close and open. Our analysis provides insight on how the markets are performing and also considers various factors which could dictate price changes in the future.
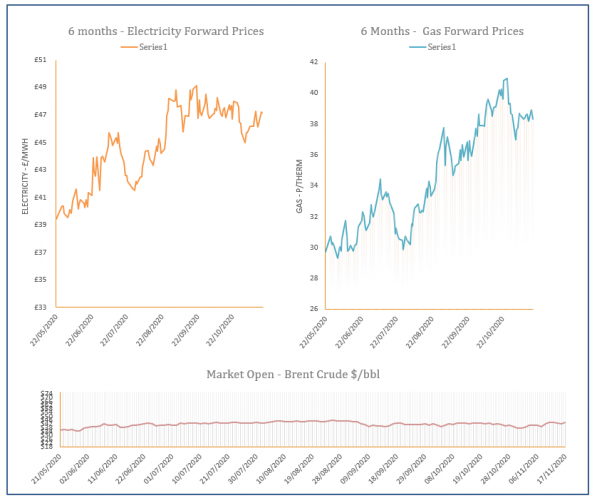
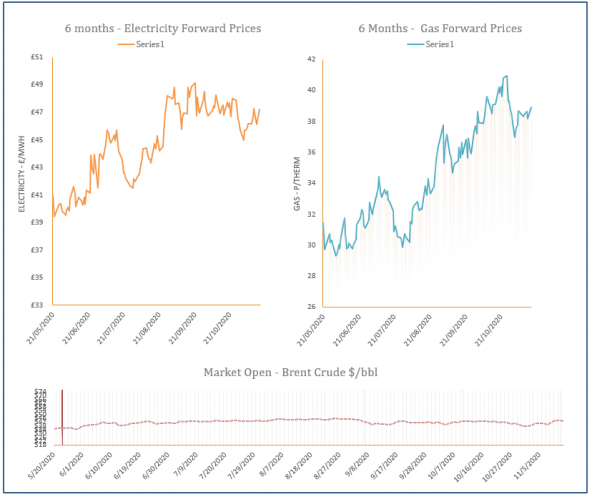
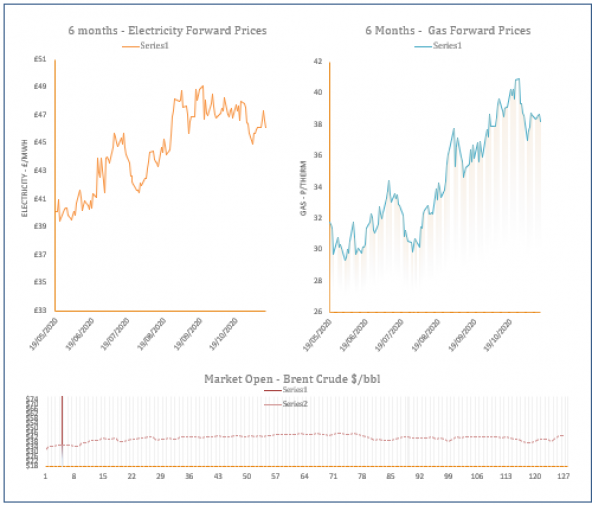
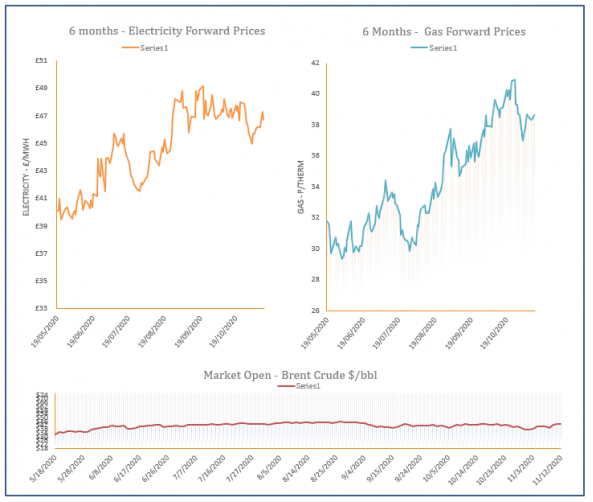
The analysis also contains a graph which tracks the one-year forward price of both gas and electricity as well as changes to Brent crude oil.
Energy Market Analysis – 17-11-2020
17th November 2020 | Posted by: Daniel Birkett | Market Analysis
Sentiment on the gas curve was little changed from last week, with low demand and healthy supply weighing on the near curve, although LNG send outs were limited. On the far curve, prices were pushed higher by stronger oil and carbon.
Energy Market Analysis – 16-11-2020
16th November 2020 | Posted by: Daniel Birkett | Market Analysis
Gas prices moved slightly higher on Friday with expectations of winter weather this week and reduced LNG output contributing to gains at the front of the curve. Further out, contracts were pushed higher by recovering oil.
Energy Market Analysis – 13-11-2020
13th November 2020 | Posted by: Lawrence Carson | Market Analysis
Gas Power Market Close Market Close Gas markets had some hope yesterday as Norwegian offshore operator Gassco indicated that an unplanned outage on Tuesday at the Oseberg field, would be extended. However, the day ahead volume impact was listed at zero, thus failing to provide any significant support to prices. Bearish sentiment was generally seen across all markets yesterday. Unseasonably …
Energy Market Analysis – 12-11-2020
12th November 2020 | Posted by: Daniel Birkett | Market Analysis
The outage at the Oseberg gas field offered support in the morning but the UK gas system remained comfortable throughout the session and near curve prices eased down. Meanwhile, commodities offered bullish resistance towards the back of the curve.

Energy Market Analysis – 11-11-2020
11th November 2020 | Posted by: Daniel Birkett | Market Analysis
Gas prices eased down on Tuesday thanks to a comfortable supply/ demand outlook, with improved renewable generation expected to reduce CCGT demand. Movement at the back of the curve was more stable due to an increase in fuel and a stronger Pound.