


Apollo Energy publishes a daily energy market analysis, focusing on the gas, power and oil markets including a commentary on how the markets close and open. Our analysis provides insight on how the markets are performing and also considers various factors which could dictate price changes in the future.
The analysis also contains a graph which tracks the one-year forward price of both gas and electricity as well as changes to Brent crude oil.
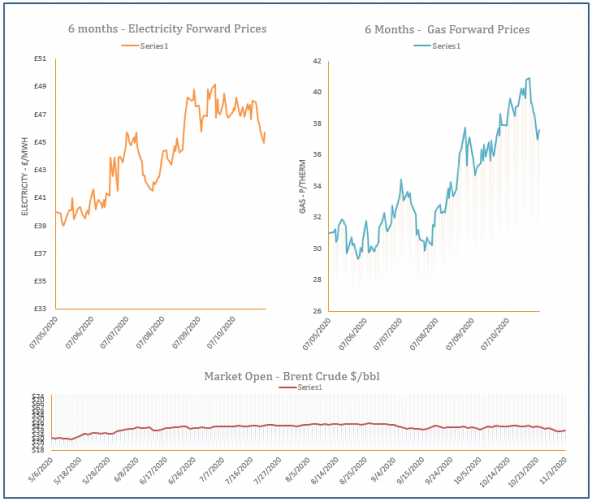
Energy Market Analysis – 03-11-2020
3rd November 2020 | Posted by: Daniel Birkett | Market Analysis
The UK gas system was well supplied throughout Monday’s session due to lower gas-fired power demand, mild temperatures and strong flows. This contributed to losses on the near curve, although longer dated contracts found some support from a late rally by oil.
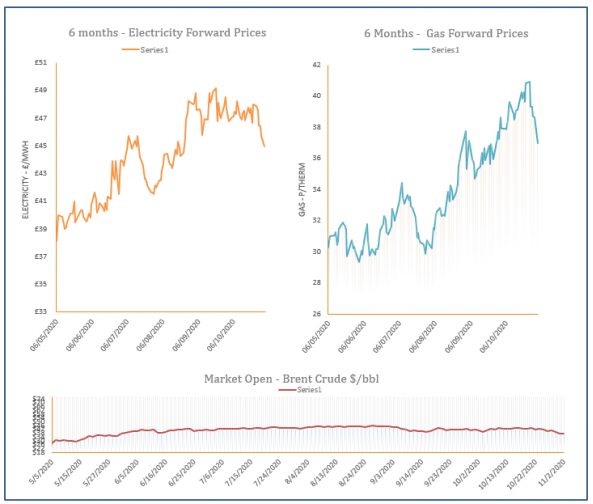
Energy Market Analysis – 02-11-2020
2nd November 2020 | Posted by: Daniel Birkett | Market Analysis
Despite a busy start to November, LNG deliveries to the UK are set to dry up due to issues at the Dragon terminal, offering some support to prices at the end of last week. However, overall sentiment was bearish due to impending lockdowns and weakening fuel markets.
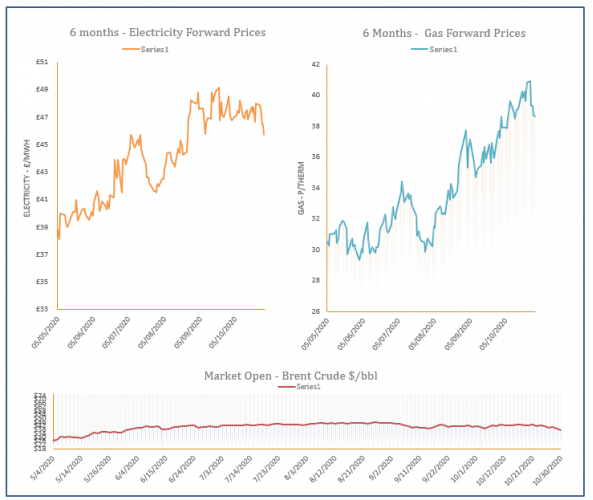
Energy Market Analysis – 30-10-2020
30th October 2020 | Posted by: Daniel Birkett | Market Analysis
A number of LNG deliveries are expected to dock in the UK at the start of November but disruption at the Dragon terminal is set to cause issues throughout the month, offering some support. Despite this, sentiment remained bearish thanks to healthy supply, weaker demand and falling commodities.
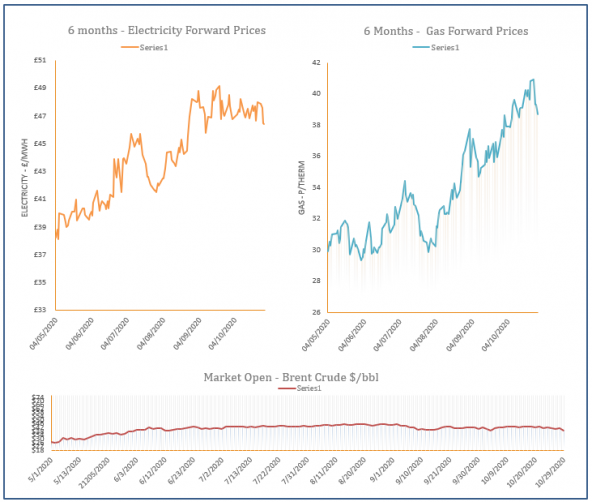
Energy Market Analysis – 29-10-2020
29th October 2020 | Posted by: Daniel Birkett | Market Analysis
Gas prices eased off during Wednesday’s session and followed downward movement displayed on overall energy markets. Maintenance at Kollsnes was also expected to be concluded today, relieving any tightness on the system.

Energy Market Analysis – 28-10-2020
28th October 2020 | Posted by: Daniel Birkett | Market Analysis
A drop in wind levels and an expected reduction in Norwegian flows into the UK offered support to near curve gas prices yesterday afternoon. Meanwhile, weakening commodity markets helped to weigh on contracts further along the curve.