


Energy Market Analysis – 29-03-2021
29th March 2021 | Posted by: Lawrence Carson | Market Analysis
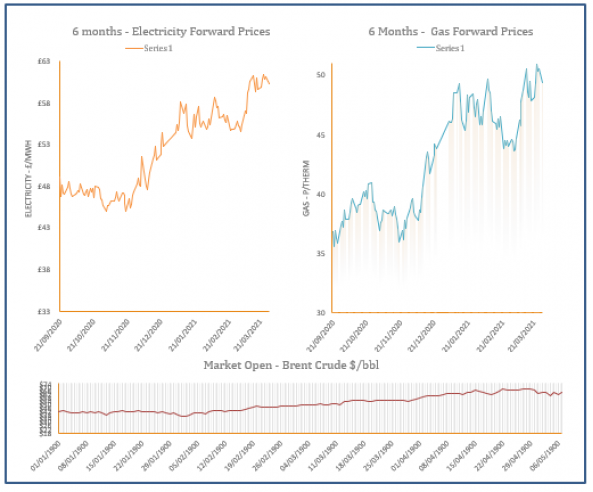
Gas prices continued to fall yesterday as the news of clearing the Suez over the weekend hit markets, April closed 1.4ppth lower than last week with Summer-21 down 1ppth.
Energy Market Analysis – 26-03-2021
26th March 2021 | Posted by: Daniel Birkett | Market Analysis
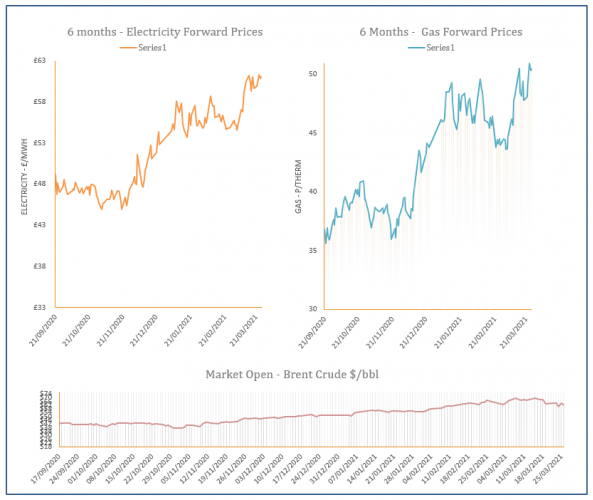
Weak demand weighed on gas contracts yesterday as strong renewable generation reduced the need for CCGT capacity and temperatures remained above the seasonal norm. Movement further out was subdued as commodity markets failed to display a clear trend.
Energy Market Analysis – 25-03-2021
25th March 2021 | Posted by: Daniel Birkett | Market Analysis
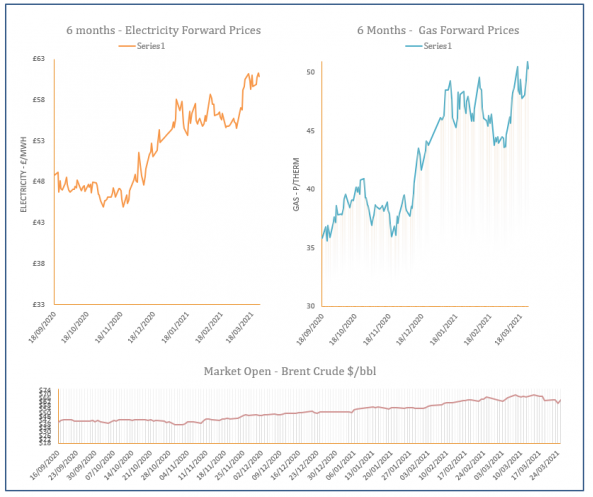
The expected delay of LNG shipments to the UK offered support to the front of the gas curve during Wednesday’s session, while the rest of the curve was slightly bearish due to weaker carbon and oil.

Energy Market Analysis – 24-03-2021
24th March 2021 | Posted by: Daniel Birkett | Market Analysis
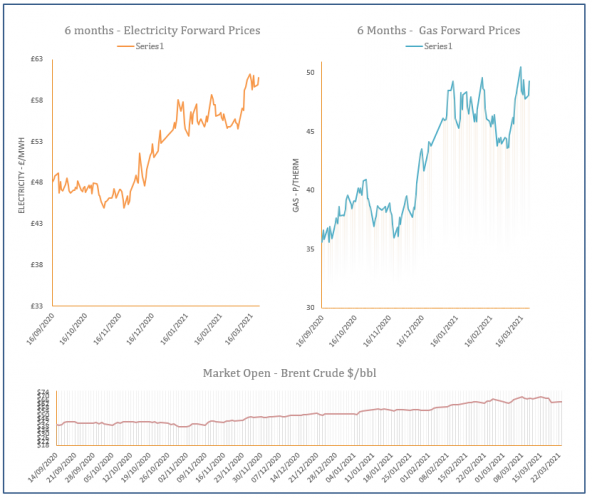
Demand levels sat well below the seasonal average during Tuesday’s session, resulting in a comfortable system despite planned maintenance reducing imports into the UK. The curve was mostly bearish as a result, with a drop in carbon allowance contracts also a factor.
Energy Market Analysis – 23-03-2021
23rd March 2021 | Posted by: Daniel Birkett | Market Analysis
Contracts along the gas curve ended the session strongly with colder weather forecasts expected to lift demand, while scheduled maintenance at facilities in Norway and the UKCS will reduce imports.