


Energy Market Analysis – 22-03-2021
22nd March 2021 | Posted by: Daniel Birkett | Market Analysis
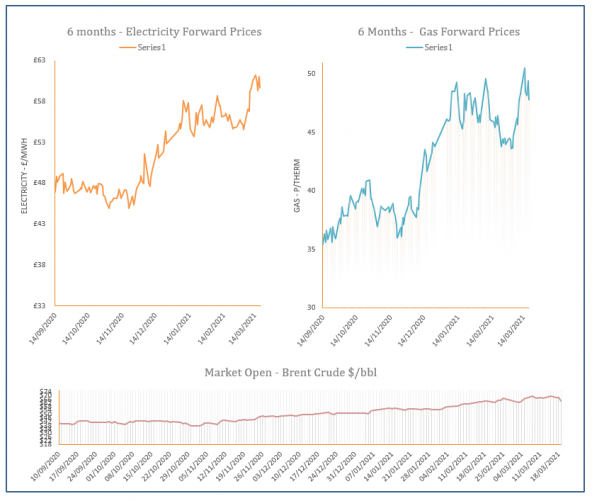
A milder weather outlook for the coming week and comfortable supply levels helped gas prices end Friday’s session lower. A significant drop in oil prices also helped to weigh on longer dated contracts with concerns regarding a second wave of the Coronavirus in Europe the main market driver.
Energy Market Analysis – 19-03-2021
19th March 2021 | Posted by: Daniel Birkett | Market Analysis
An uptick in demand and reduced imports resulted in a tighter gas system during Thursday’s session which led to bullish movement across the curve. A further rally on carbon markets also offered support to longer dated contracts.

Energy Market Analysis – 18-03-2021
18th March 2021 | Posted by: Daniel Birkett | Market Analysis
Strong LNG send-outs and reduced demand contributed to an oversupplied system throughout Wednesday’s session, resulting in losses across the near curve. Bearish movement could also be seen further out with minimal support provided by commodity markets.

Energy Market Analysis – 17-03-2021
17th March 2021 | Posted by: Daniel Birkett | Market Analysis
Improved imports, a drop in demand and high LNG send-outs resulted in a long UK gas system yesterday which helped to pressure down near curve prices. Meanwhile, longer dated contracts followed falling oil markets.

Energy Market Analysis – 16-03-2021
16th March 2021 | Posted by: Daniel Birkett | Market Analysis
Gas prices continued to move higher during Monday’s session, following a rise in commodities. However, any upward movement on the near curve was offset by a long system and a weaker demand forecast.