


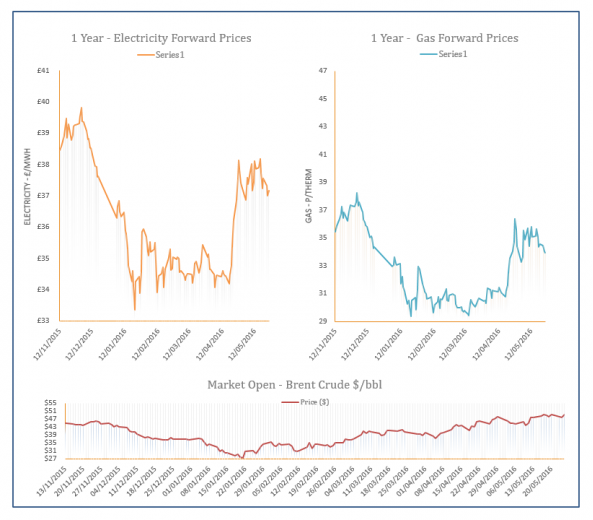
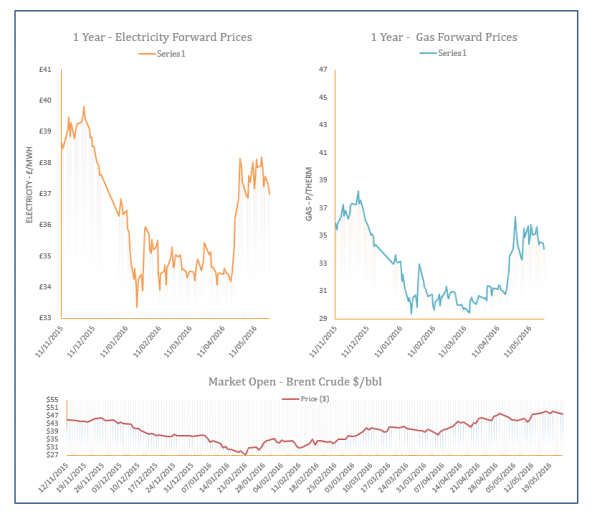
Energy Market Analysis - 31-05-2016
31st May 2016 | Posted by: Natalie Ormrod | Market Analysis
Gas prices continued to increase on Friday, as supply from Norway was disrupted due to maintenance work at the Kollsnes plant. The warmer temperatures over the Bank Holiday weekend contributed to a downward movement on the Day-ahead contract.
Energy Market Analysis - 27-05-2016
27th May 2016 | Posted by: Natalie Ormrod | Market Analysis
Gas prices posted additional gains yesterday, supported by unplanned outages on Norwegian supply that left the system undersupplied, and the rise in the oil price. This was despite lower demand as warmer temperatures were forecasted.
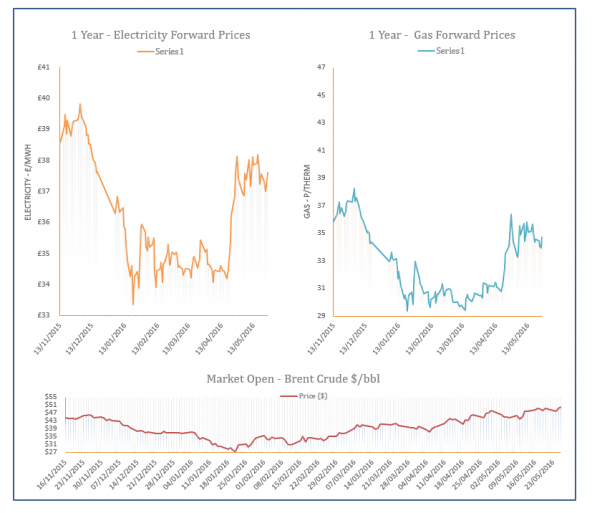
Energy Market Analysis - 26-05-2016
26th May 2016 | Posted by: Natalie Ormrod | Market Analysis
Gas prices were pushed higher yesterday, amid lower temperatures and a strong rebound in Brent oil prices. Norwegian flows increased and demand was expected to be lower on the back of higher temperatures.
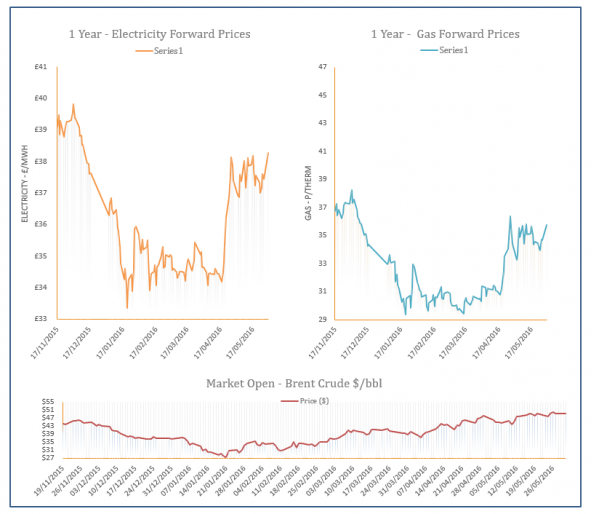
Energy Market Analysis - 25-05-2016
25th May 2016 | Posted by: Natalie Ormrod | Market Analysis
Spot and near-curve prices were mixed yesterday with lower Norwegian supply tightening the system, while a surge in the value of the Pound put pressure on prices. The stronger US dollar weakened oil prices and limited gains on the far-curve.
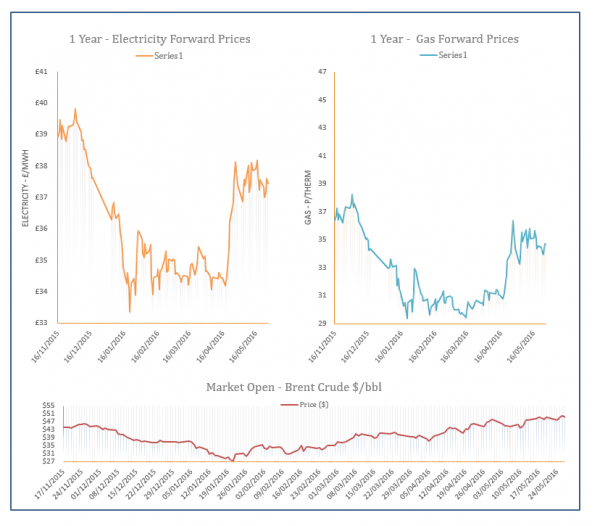
Energy Market Analysis - 24-05-2016
24th May 2016 | Posted by: Natalie Ormrod | Market Analysis
The sharp rise in Norwegian flows, while demand was weaker than expected, pushed spot and near-curve prices lower yesterday. The fall in oil prices provided additional bearish pressure.