


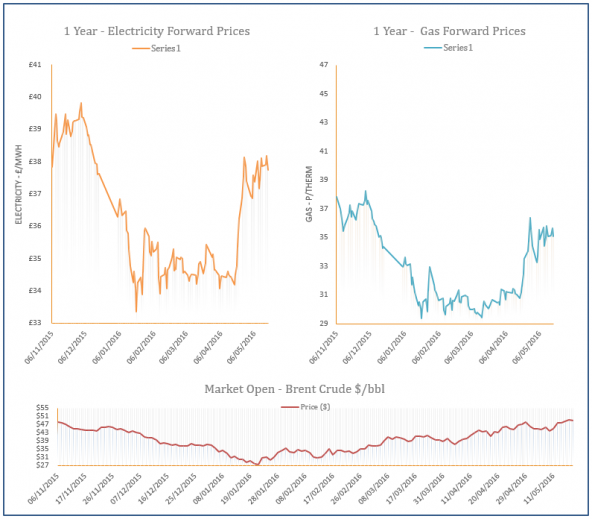
Energy Market Analysis - 23-05-2016
23rd May 2016 | Posted by: Natalie Ormrod | Market Analysis
Higher storage injections supported near-curve prices on Friday. Stronger oil prices supported the gas far-curve as the US Dollar weakened slightly.
Energy Market Analysis - 20-05-2016
20th May 2016 | Posted by: Natalie Ormrod | Market Analysis
Spot and near-curve prices continued to weaken yesterday on the back of lower demand and comfortable supply. The ongoing weakening of the Euro against the Pound also contributed to the downturn.
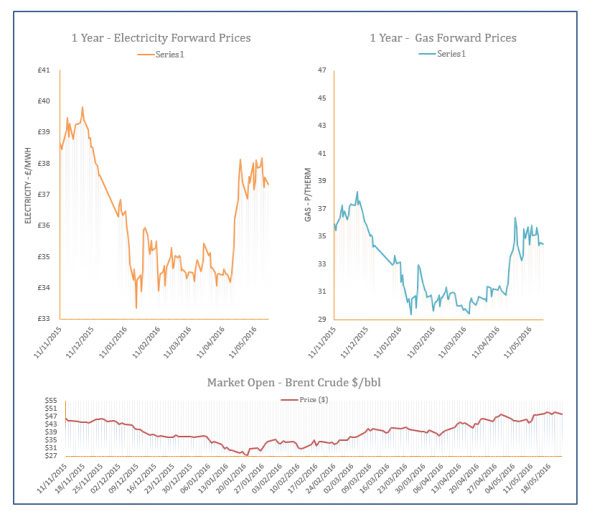
Energy Market Analysis - 19-05-2016
19th May 2016 | Posted by: Daniel Birkett | Market Analysis
Losses were displayed across the gas curve yesterday following a significant improvement in Norwegian and LNG flows. Bearish pressure was also provided by an expected rise in temperatures next week and a stronger Pound, while falling Brent weighed on contracts further along the curve.
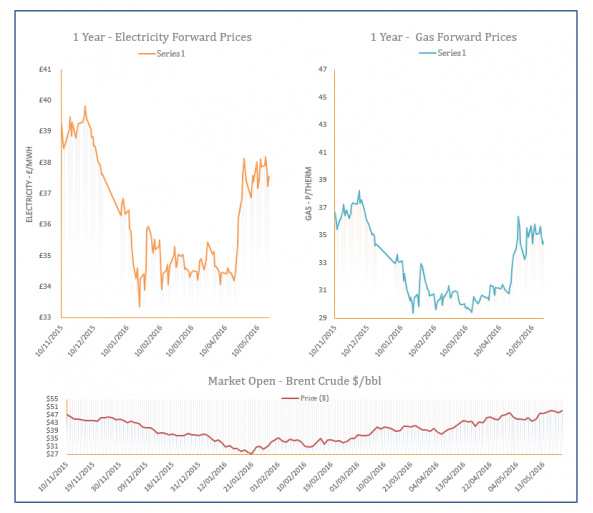
Energy Market Analysis - 18-05-2016
18th May 2016 | Posted by: Daniel Birkett | Market Analysis
Gas contracts displayed mixed movement on Tuesday as improved LNG supply and a stronger Pound helped to erase some of the morning’s gains. Norwegian flows remained weak throughout the session which tightened the system, while bullish oil prices supported far-curve contracts.

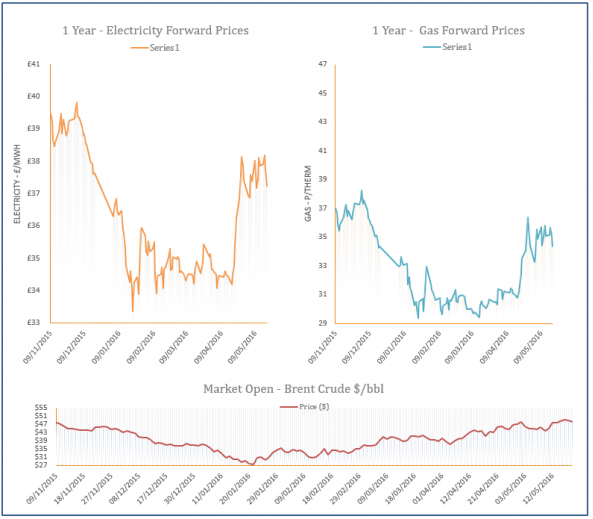
Energy Market Analysis - 17-05-2016
17th May 2016 | Posted by: Daniel Birkett | Market Analysis
Norwegian flows into the UK decreased yesterday which resulted in numerous gains across the curve, although some European contracts displayed no change due to various bank holidays. Early in the session Langeled output stood at 53mcm but fell to 14mcm in the afternoon which resulted in a tight UK gas system. Meanwhile, a sharp rise in oil prices continues to push far-curve contracts higher with on-going supply concerns the main market driver.